Coalescence Report 29th May - 5th June 2022
The Weekly Coalescence Sentiment Report: 29/05/2022 - 05/06/2022
This report covers the weekly market sentiment and positioning and any changes that have occurred which might present interesting configurations on different asset classes with a specific focus on currencies. The below shows the table of contents of the report:
The COT Report
Introduction to the COT Report
EUR Currency
CHF Currency
GBP Currency
JPY Currency
CAD Currency
Interesting Cross Ideas
Historical Track Record
The Chaos Impact Index
Introduction to the Chaos Impact Index
EUR Currency
CHF Currency
GBP Currency
JPY Currency
CAD Currency
Gold
The White Index
Introduction to the White Index
S&P500
Historical Track Record
Vision
Introduction to Vision
S&P500
Historical Track Record
The VIX
Introduction to the VIX
S&P500
Historical Track Record
The Weekly S&P500 Sentiment Indicator
Introduction to the Weekly S&P500 Sentiment Indicator
S&P500
The Millennium Forecast
Introduction to the Millennium Forecast
ISM PMI
Historical Track Record
Bitcoin Tactical Sentiment Index
Introduction to the Bitcoin Tactical Sentiment Index
Bitcoin
Historical Track Record
University of Michigan’s Consumer Sentiment Index
Disclosure
1. The COT Report
As mentioned in the introductory post, the COT report shows the positioning of the market with respect to a few underlying assets and currencies. The COT strategies are as follows:
The COT1 strategy uses a normalization technique to detect imminent market shifts while minimizing lag as much as possible.
The COT2 strategy uses a statistical technique to detect sentiment extremes that are bound to reverse.
The COT3 strategy uses a deceleration filter to detect exhaustion in positioning trends.
The COT4 strategy uses a pattern recognition technique to detect imminent reversals in sentiment.
EUR Currency
Signals from the EUR currency can be used to understand the expected directional bias of the USDEUR pair or any other EUR pair.
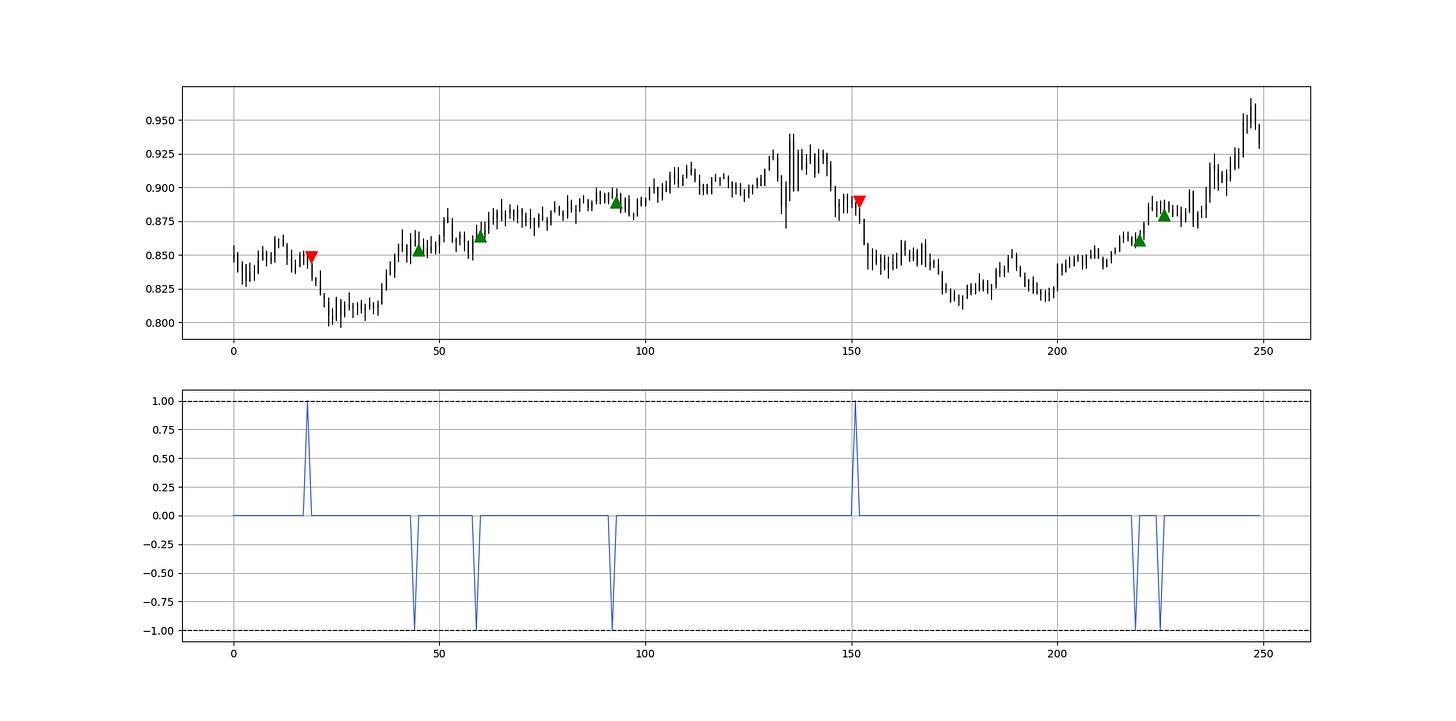
The following signal chart shows the latest 250 data with the COT1 signals.
The charts use major proxies versus the USD: EUR is represented by USDEUR, CHF is represented by USDCHF, GBP is represented by USDGBP, JPY is represented by USDJPY, and CAD is represented by USDCAD.
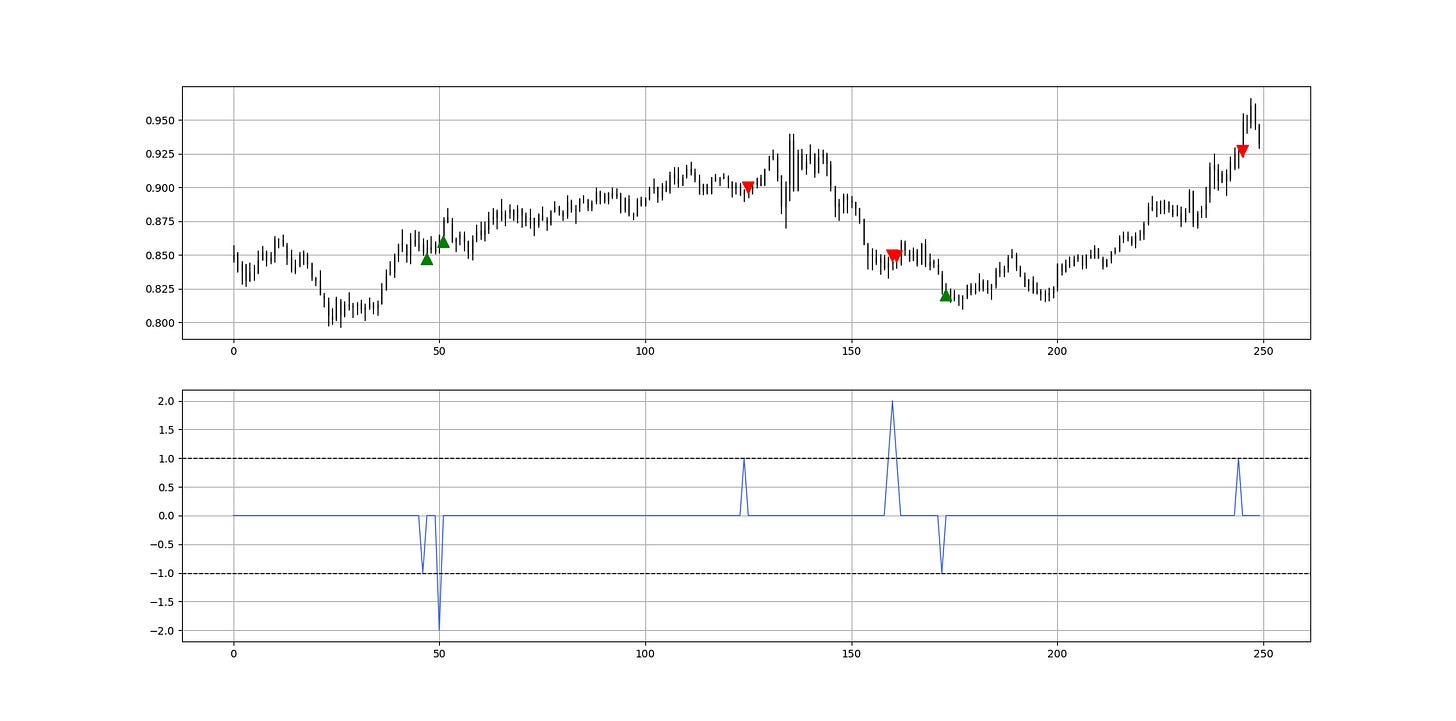
The following signal chart shows the latest 250 data with the COT2 signals.
Green arrows point to a bullish sentiment signal while red arrows point to a bearish sentiment signal.
The following signal chart shows the latest 250 data with the COT3 signals.
The following signal chart shows the latest 250 data with the COT4 signals.
Commentary
It looks like the phase of stabilization predicted by COT2 is showing its fruits. It seems that the EUR currency is more likely to recover slightly but there is not much potential left according to the COT2 signal.
CHF Currency
Signals from the CHF currency can be used to understand the expected directional bias of the USDCHF pair or any other CHF pair.
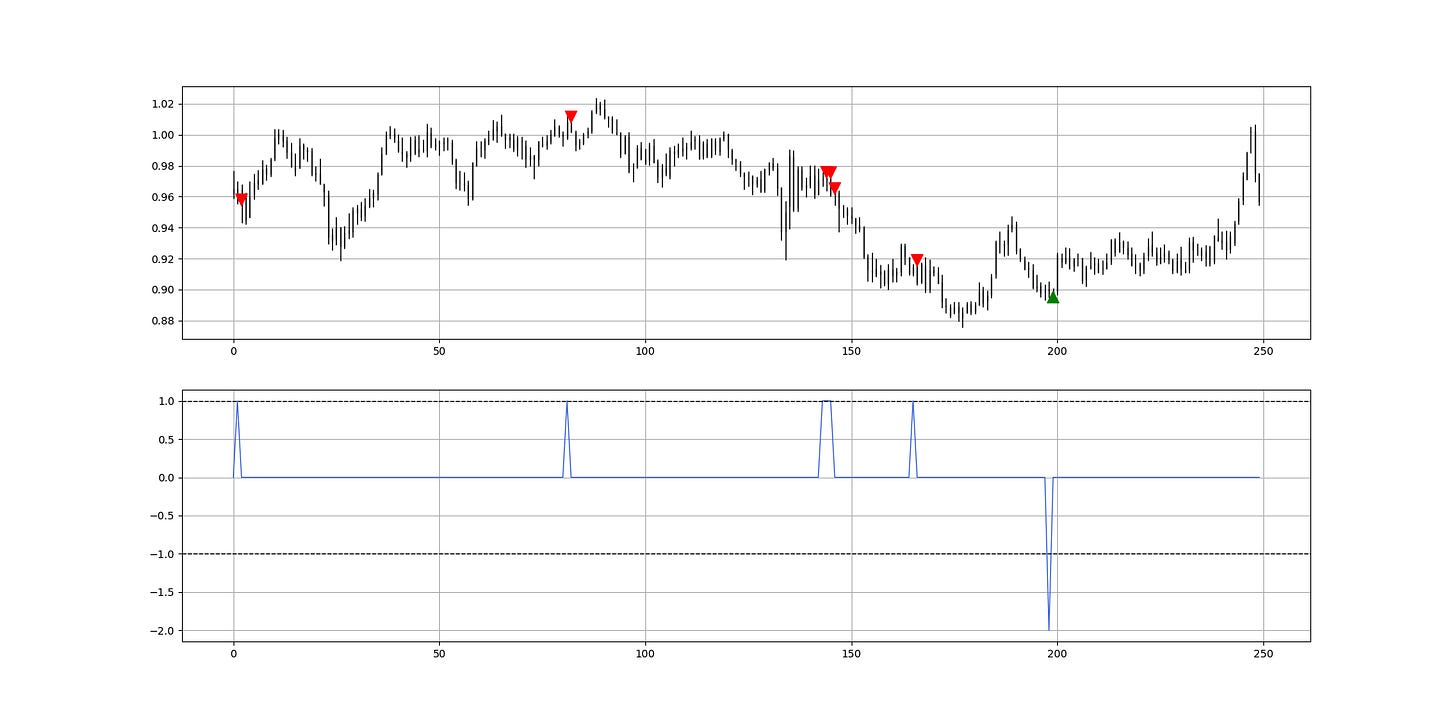
The following signal chart shows the latest 250 data with the COT1 signals.
The blue indicator in the second panel is the representation of positioning (and sentiment) with the barriers at 2 and -2.
The following signal chart shows the latest 250 data with the COT2 signals.
The following signal chart shows the latest 250 data with the COT3 signals.
The following signal chart shows the latest 250 data with the COT4 signals.
Commentary
The COT3 strategy is showing that there may likely be a bullish reaction around the current levels.
Keep reading with a 7-day free trial
Subscribe to The Weekly Market Sentiment Report to keep reading this post and get 7 days of free access to the full post archives.


