


Coalescence Report 8th May - 14th May 2022
The Weekly Coalescence Sentiment Report: 08/05/2022 - 14/05/2022

This report covers the weekly market sentiment and positioning and any changes that have occurred which might present interesting configurations on different asset classes with a specific focus on currencies. The below shows the table of contents of the report:
The COT Report
Introduction to the COT Report
EUR Currency
CHF Currency
GBP Currency
JPY Currency
CAD Currency
Interesting Cross Ideas
Historical Track Record
The Chaos Impact Index
Introduction to the Chaos Impact Index
EUR Currency
CHF Currency
GBP Currency
JPY Currency
CAD Currency
Gold
The White Index
Introduction to the White Index
S&P500
Historical Track Record
Vision
Introduction to Vision
S&P500
Historical Track Record
The VIX
Introduction to the VIX
S&P500
Historical Track Record
The Weekly S&P500 Sentiment Indicator
Introduction to the Weekly S&P500 Sentiment Indicator
S&P500
The Millennium Forecast
Introduction to the Millennium Forecast
ISM PMI
Historical Track Record
Bitcoin Tactical Sentiment Index
Introduction to the Bitcoin Tactical Sentiment Index
Bitcoin
Historical Track Record
Disclosure

1. The COT Report

As mentioned in the introductory post, the COT report shows the positioning of the market with respect to a few underlying assets and currencies. The COT strategies are as follows:
The COT1 strategy uses a normalization technique to detect imminent market shifts while minimizing lag as much as possible.
The COT2 strategy uses a statistical technique to detect sentiment extremes that are bound to reverse.
The COT3 strategy uses a deceleration filter to detect exhaustion in positioning trends.
The COT4 strategy uses a pattern recognition technique to detect imminent reversals in sentiment.
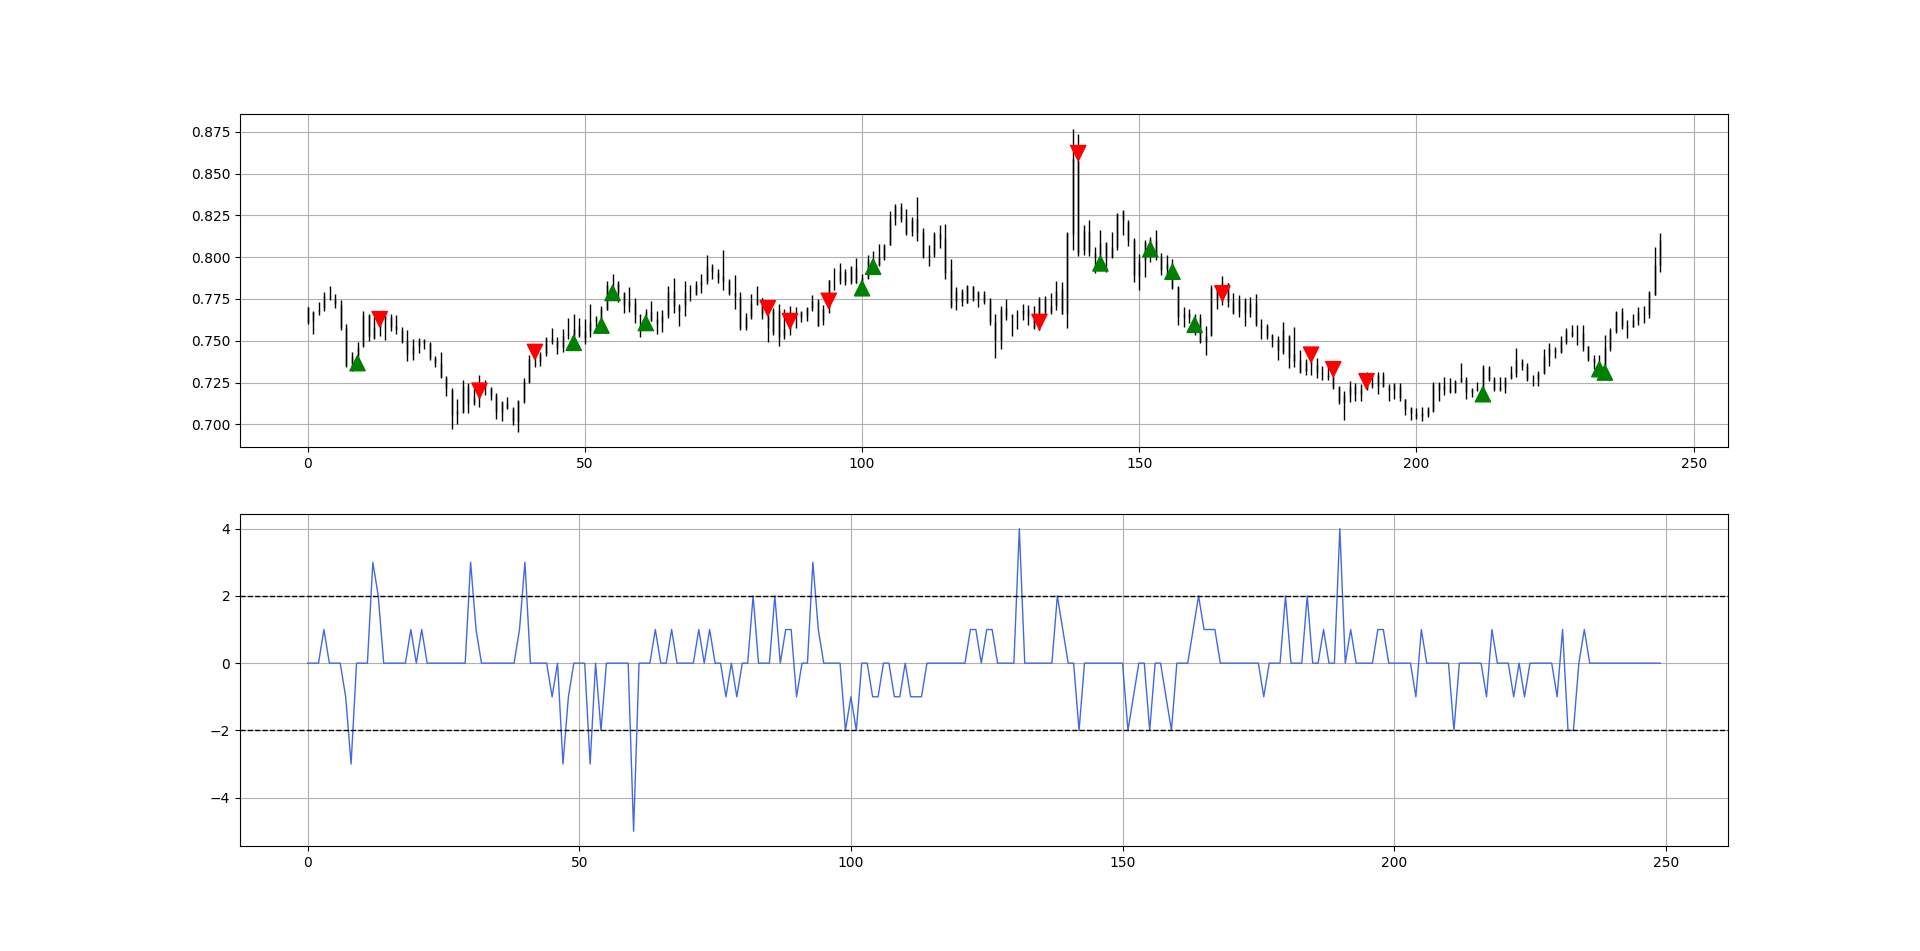
EUR Currency
Signals from the EUR currency can be used to understand the expected directional bias of the USDEUR pair or any other EUR pair.
The following signal chart shows the latest 250 data with the COT1 signals.

The charts use major proxies versus the USD: EUR is represented by USDEUR, CHF is represented by USDCHF, GBP is represented by USDGBP, JPY is represented by USDJPY, and CAD is represented by USDCAD.
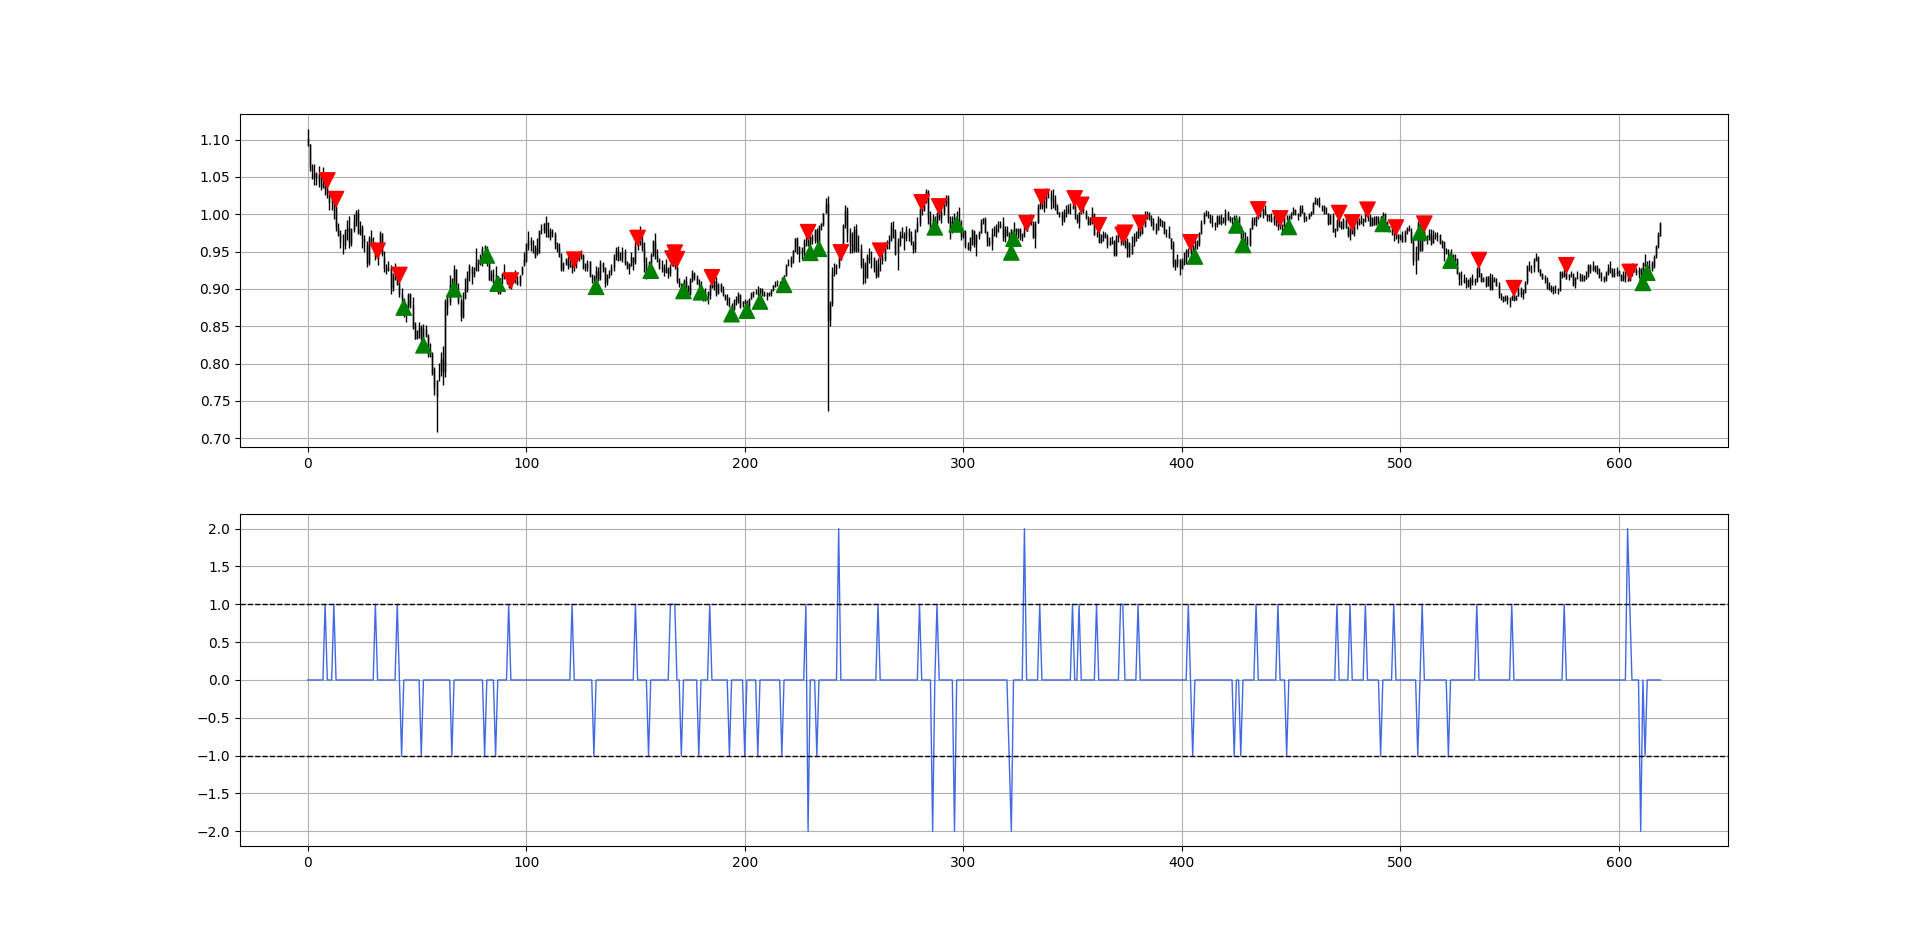
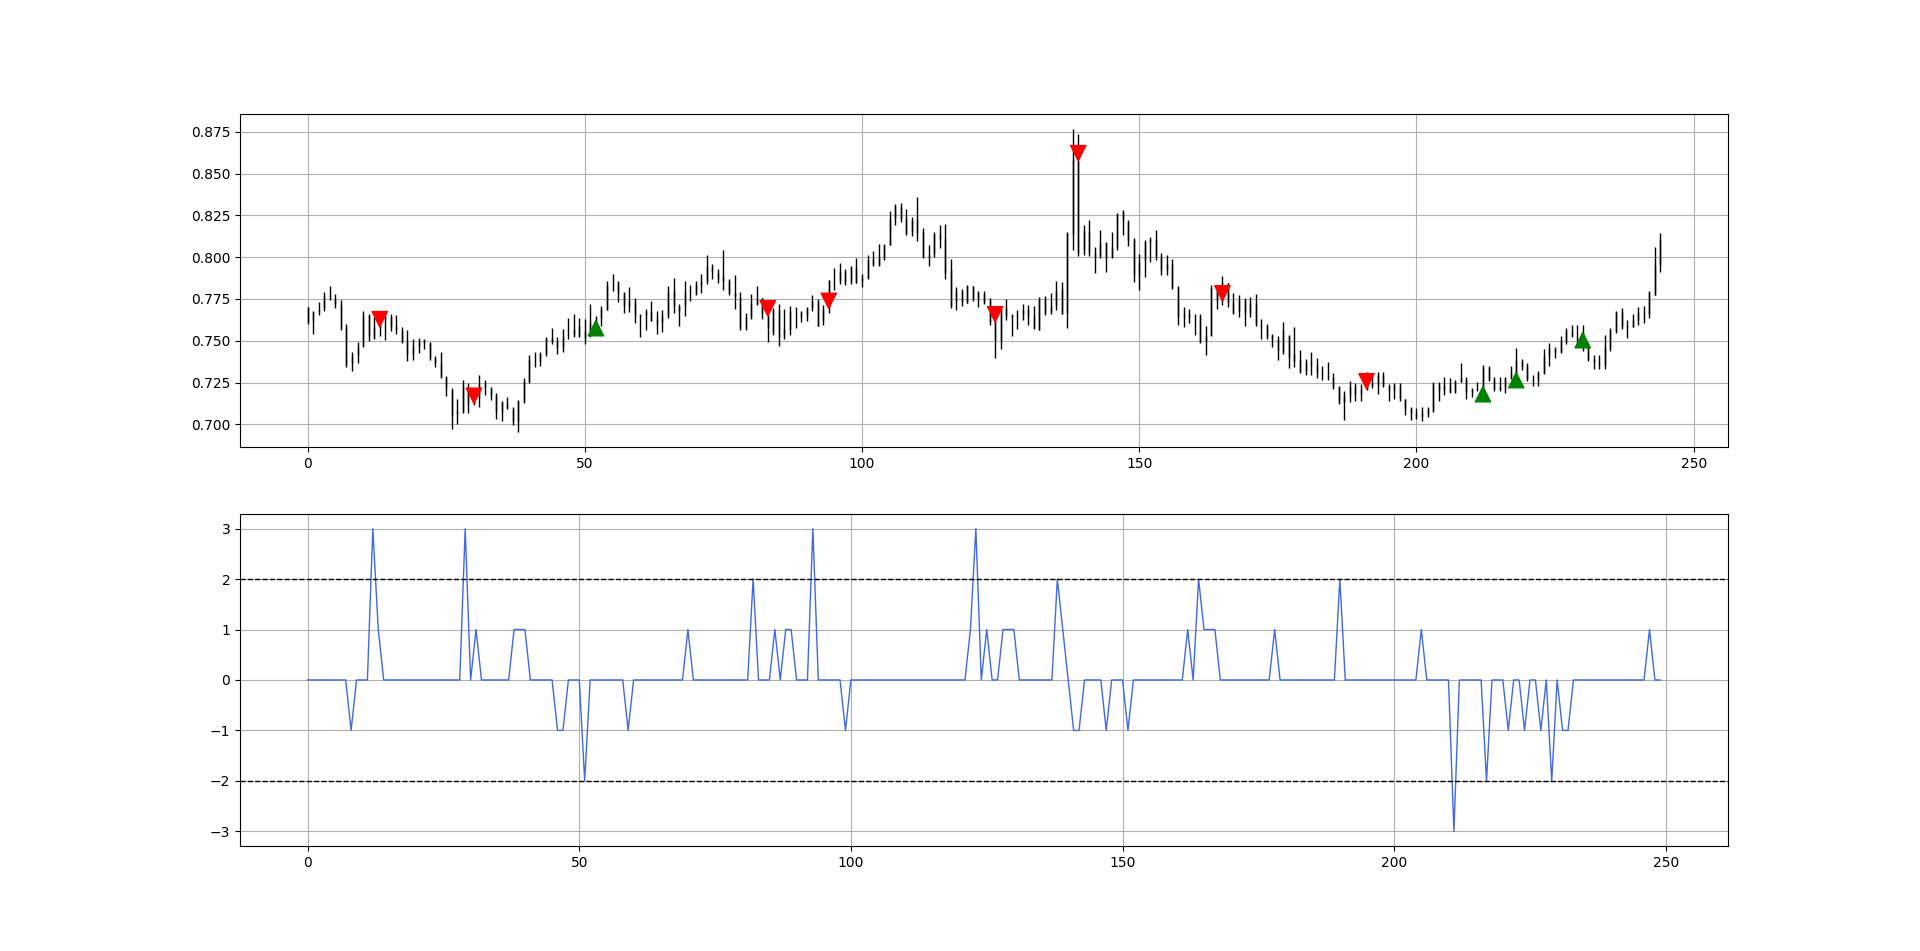
The following signal chart shows the latest 250 data with the COT2 signals.
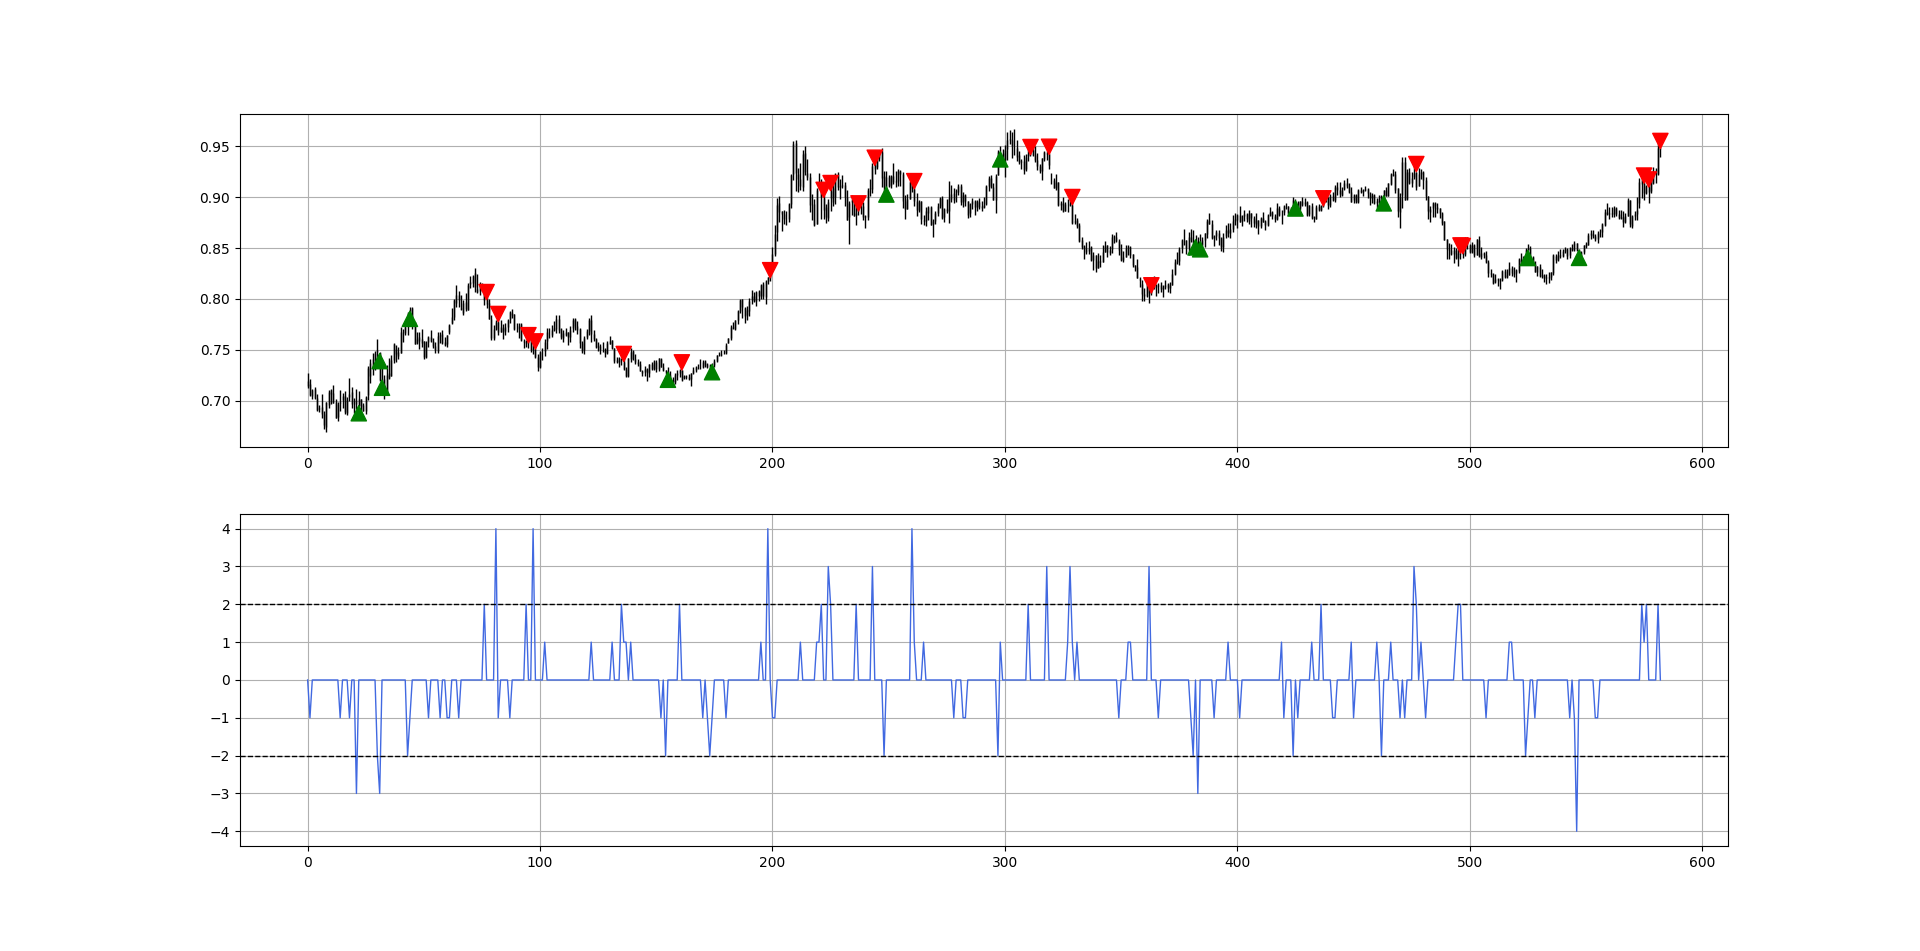
Green arrows point to a bullish sentiment signal while red arrows point to a bearish sentiment signal.
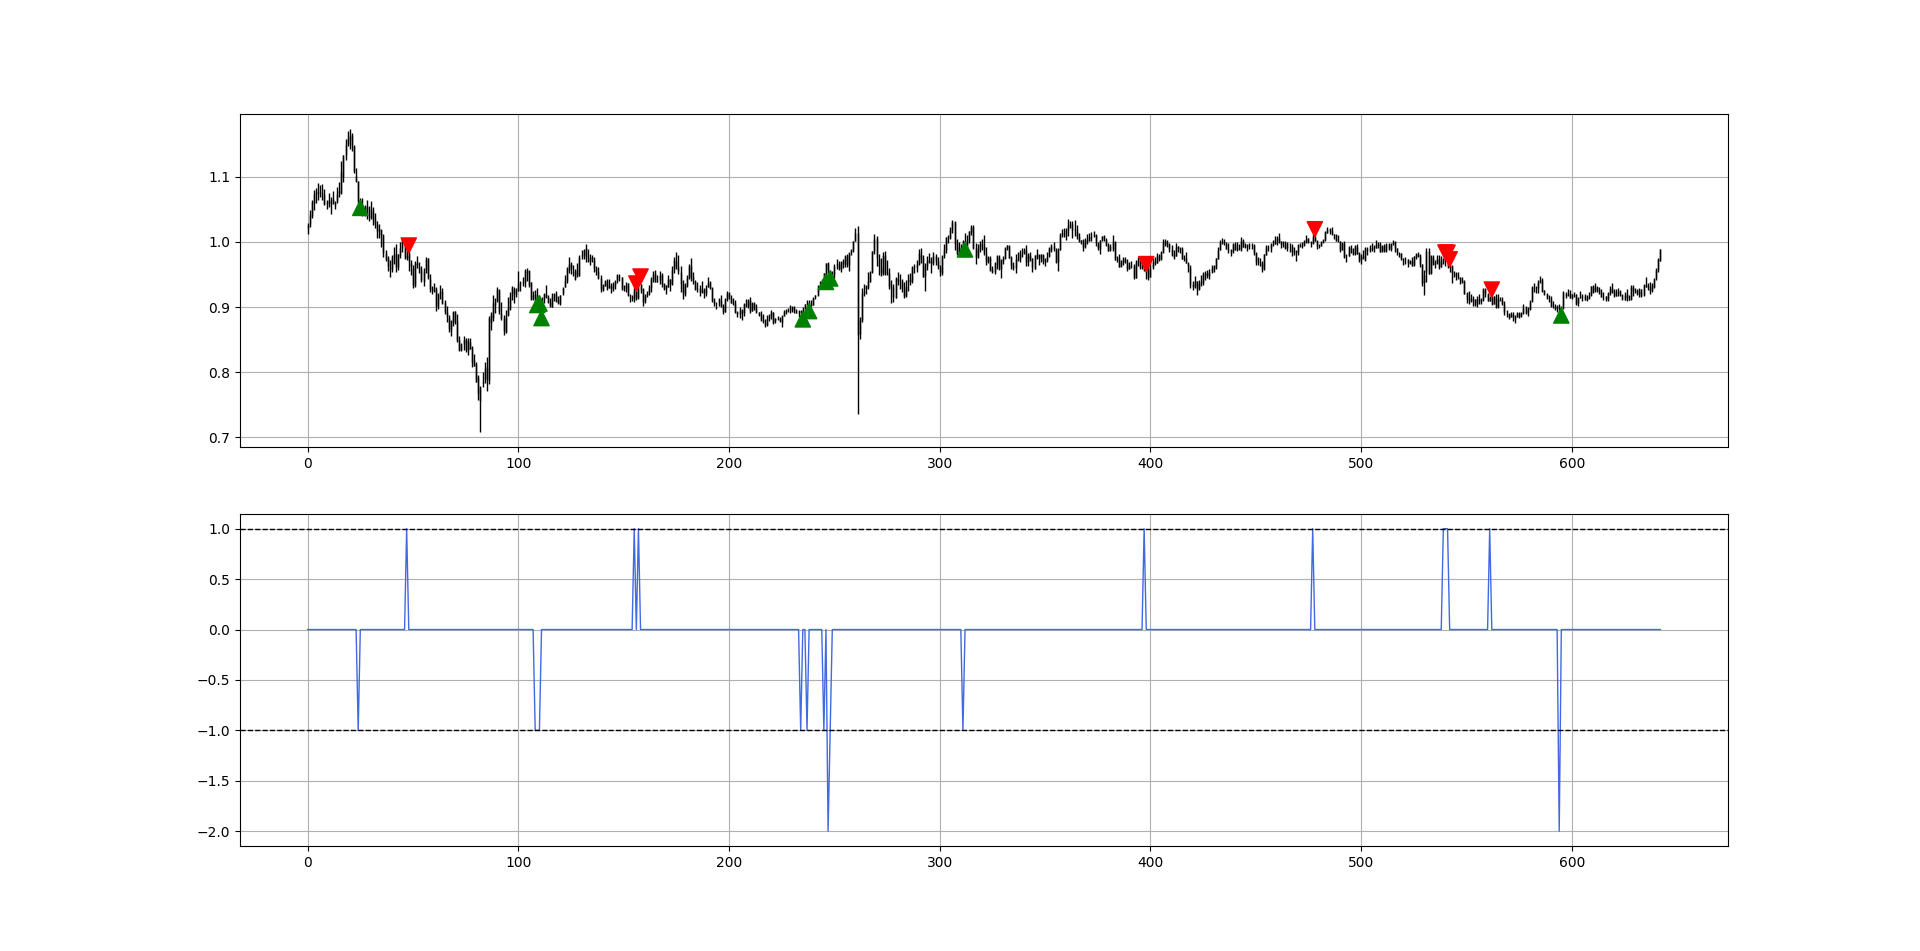
The following signal chart shows the latest 250 data with the COT3 signals.

The following signal chart shows the latest 250 data with the COT4 signals.

Commentary
It looks like a phase of stabilization/bounce on the EUR currency can be expected as shown by COT2 and COT3 strategies.
CHF Currency
Signals from the CHF currency can be used to understand the expected directional bias of the USDCHF pair or any other CHF pair.
The following signal chart shows the latest 250 data with the COT1 signals.

The blue indicator in the second panel is the representation of positioning (and sentiment) with the barriers at 2 and -2.
The following signal chart shows the latest 250 data with the COT2 signals.

The following signal chart shows the latest 250 data with the COT3 signals.
The following signal chart shows the latest 250 data with the COT4 signals.
Commentary
The signals on CHF are mostly neutral with the previous bullish signals reaching their potential.
GBP Currency
Signals from the GBP currency can be used to understand the expected directional bias of the USDGBP pair or any other GBP pair.
The following signal chart shows the latest 250 data with the COT1 signals.
The following signal chart shows the latest 250 data with the COT2 signals.
The following signal chart shows the latest 250 data with the COT3 signals.

A cluster of signals enhances the conviction.
The following signal chart shows the latest 250 data with the COT4 signals.

Commentary
The COT4 strategy shows that the GBP currency may continue its weakness as shown by the bullish signal on the USDGBP pair. The last three bullish signals were profitable.
JPY Currency
Signals from the JPY currency can be used to understand the expected directional bias of the USDJPY pair or any other JPY pair.
The following signal chart shows the latest 250 data with the COT1 signals.

USDJPY has more signals in the COT1 strategy than the others because its model is slightly different than the others (which are homogeneous).
The following signal chart shows the latest 250 data with the COT2 signals.

The following signal chart shows the latest 250 data with the COT3 signals.

It may happen that from time to time, no sentiment signal occurs for a long time.
The following signal chart shows the latest 250 data with the COT4 signals.

Commentary
Three out of four strategies point to a continued JPY weakness which points to a USDJPY that continues its move upwards.
CAD Currency
Signals from the CAD currency can be used to understand the expected directional bias of the USDCAD pair or any other CAD pair.
The following signal chart shows the latest 250 data with the COT1 signals.

The following signal chart shows the latest 250 data with the COT2 signals.

The following signal chart shows the latest 250 data with the COT3 signals.

Sentiment signals must not be used as trade recommendations or investment solicitations.
The following signal chart shows the latest 250 data with the COT4 signals.

Commentary
The COT2 strategy hints at a possible CAD strengthening (weakness of USDCAD). No strong signal is present elsewhere.
Interesting Cross Ideas
A cross is a currency pair without the USD. An example of this would be EURCAD. The interesting part comes with the fact of the double conviction event which is having a bullish signal on the base currency and a bearish signal on the price currency.
With a positive signal on the CAD currency and a negative signal on the JPY currency, an interesting cross to monitor would be a bullish CADJPY.
Historical Track Record
As a reminder, the next table shows the historical non-binding track record of the model using the specific back-testing rules described in the introductory post.
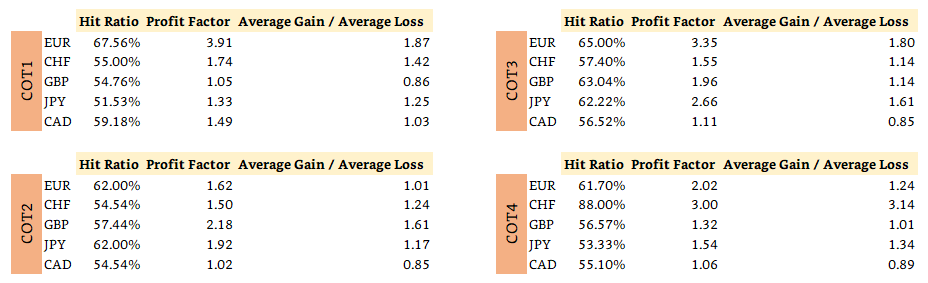
Past results are not representative of future results.

2. The Chaos Impact Index
The Chaos Impact Index is a calculation based on many variables from different areas such as opinions, volatility, momentum, short-term flows, and psychological factors. Its name comes from the fact that it tries to find hidden patterns within the chaos of the elements it is comprised of.
The Chaos Impact Index is calculated on a daily basis but is part of a weekly document and therefore, if a signal occurs during the week, an email and a post would be sent with the market expectations post-signal. The index is presented as a binary event where it shows the market sentiment:
Whenever the market sentiment is bullish, the market is shown in green.
Whenever the market sentiment is bearish, the market is shown in red.
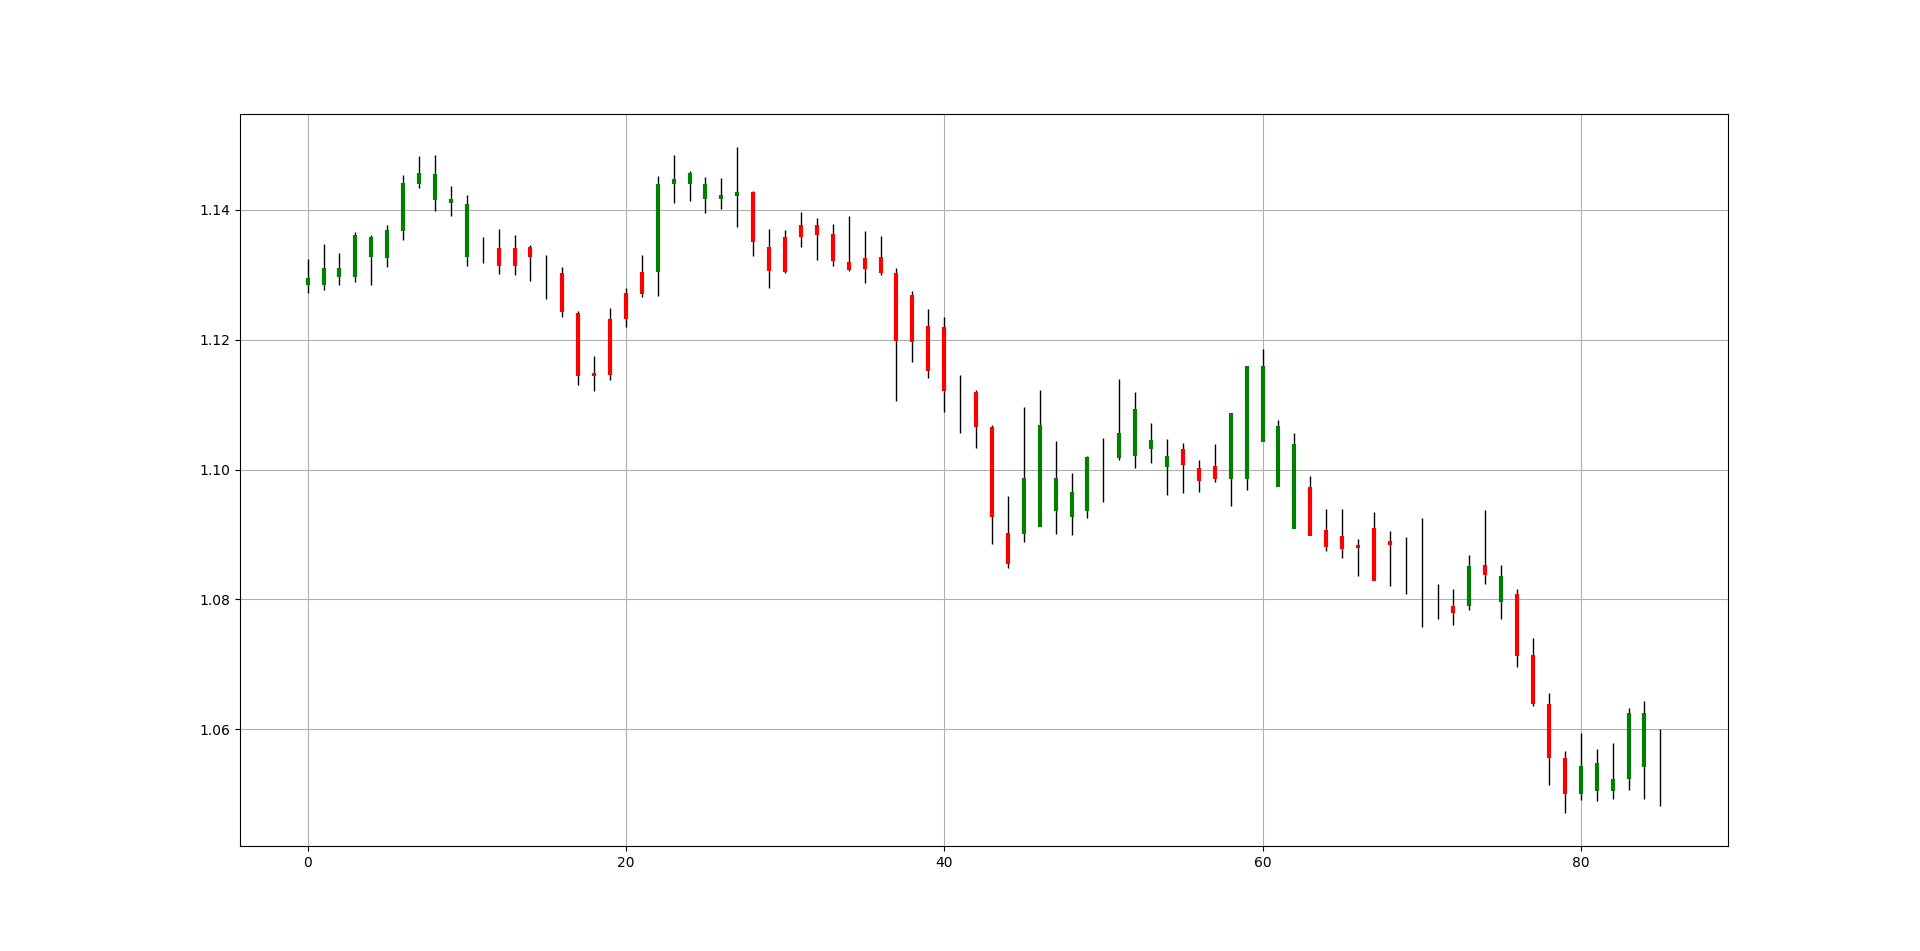
EUR Currency
The following signal chart shows the daily data since the beginning of 2022.
Commentary
The recent bullish sentiment candlesticks point out to a possible stabilization expected by market participants around the current levels.
CHF Currency
The following signal chart shows the daily data since the beginning of 2022.

Commentary
The recent bullish sentiment candlesticks point out to a possible stabilization expected by market participants around the current levels.
GBP Currency
The following signal chart shows the daily data since the beginning of 2022.

Commentary
The recent bearish sentiment candlesticks point out to a possible downside continuation expected by market participants.
JPY Currency
The following signal chart shows the daily data since the beginning of 2022.

Commentary
The recent mixed sentiment candlesticks show no clear bias from market participants although the bearish JPY trend is clear.
CAD Currency
The following signal chart shows the daily data since the beginning of 2022.

Commentary
The sentiment candlesticks are extremely mixed and show no directional bias even though the recent two bars are bearish.
Gold
The following signal chart shows the daily data since the beginning of 2022.

Commentary
The recent bullish sentiment candlesticks point out to a possible stabilization expected by market participants.
Sentiment expectations by market participants represent an average of opinions an not a perfect directional indicator.

3. The White Index

Long-only traders who like to time the dips and follow the upside trend should monitor the White Index as it has been specifically designed for this purpose.
The following signal chart shows the latest 1000 data with the signals.
Commentary
At the moment, the White Index is neutral and no signal is given. The White Index is calculated on a daily basis but is part of a weekly document and therefore, if a signal occurs during the week, an email and a post would be sent with the market expectation post-signal.
Historical Track Record
As a reminder, the next table shows the historical non-binding track record of the model using the specific back-testing rules described in the introductory post.

Past results are not representative of future results.
4. Vision

Vision uses insights from dealer markets to find statistical extremes. Rich with information, the indicator seems to outperform its peers in predictability.
The following signal chart shows the latest 1000 data with the signals.

Commentary
Patience is key with Vision as even though its signals are uncommon, they are of high quality. Vision is calculated on a daily basis but is part of a weekly document and therefore, if a signal occurs during the week, an email and a post would be sent with the market expectation post-signal.
Historical Track Record
As a reminder, the next table shows the historical non-binding track record of the model using the specific back-testing rules described in the introductory post.
Past results are not representative of future results.

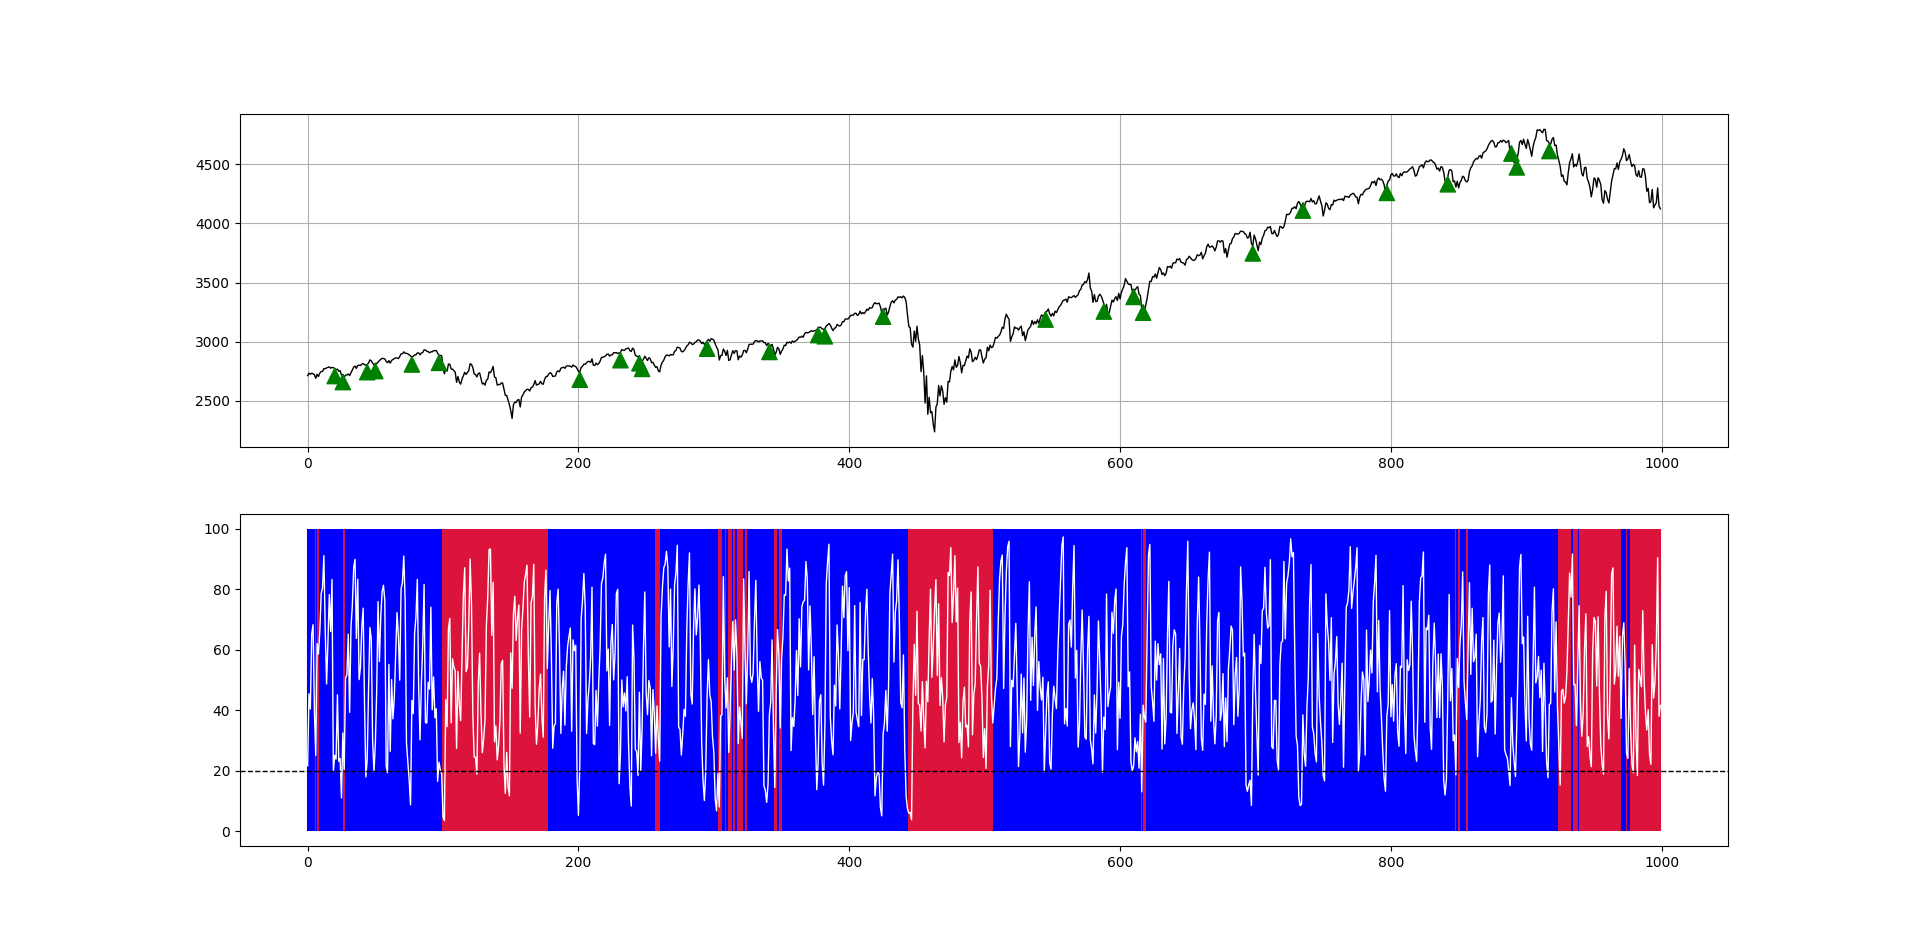
5. The VIX
The CBOE’s Volatility Index is a continuously updated index that shows the market’s expectations for the strength of short-term changes of the S&P500. Since it is calculated from near-term options on the S&P500, it can be considered as a 30-day projection of future volatility. It is negatively correlated with the S&P500 and therefore, high extreme values are associated with a bottom of the stock market while low extreme values are somewhat associated with a correction on the stock market even though the bearish predictive ability of the VIX is not significant.
The following signal chart shows the latest 500 observations of the inverted VIX (for better interpretability) with the signals.

Commentary
The divergence signals on the VIX are not very common and are better in a bullish market even though bearish divergence signals may point to a correction or a stabilization phase. At the moment, no signals are present.
Historical Track Record
As a reminder, the next table shows the historical non-binding track record of the model using the specific back-testing rules described in the introductory post.
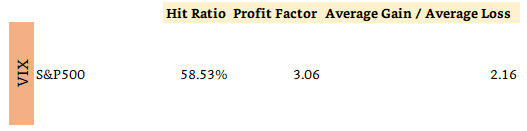
Past results are not representative of future results.
6. The Weekly S&P500 Sentiment Indicator
The Weekly S&P500 Sentiment Indicator is a simple calculation that seeks to measure the stability of the US index through a weekly sentiment technique. It is mostly used like the Chaos Impact Index with the following key points to keep in mind:
Green price action: The current regime is extremely bullish.
Blue price action: The current regime is bullish.
Red price action: The current regime is mixed and a phase of correction may be overdue but it does not necessarily point to a bearish market.
The following signal chart shows the latest 500 observations of the S&P500 with the indicator superimposed.

Commentary
At the moment, the market is alternating between green and blue which signifies that the current bullish regime remains unscathed.
7. The Millennium Forecast

During the introductory post, you must have understood that the Millennium Forecast targets the long-term as opposed to other indicators.
The following Figure shows a window of the last number of observations of the ISM PMI with the signals generated by the Millennium Forecast. Refer to the commentary below to understand what to expect.

Remember that the two outputs of the Millennium Forecast are as follows:
Expansion: This label represents an economic non-linear expansion.
Contraction: This label represents an economic non-linear contraction.
Commentary
The Millennium Forecast is neutral at the moment with the last signal given in February 2020 for an expansion signal that at the moment has not yet been reversed which means that the algorithm does not forecast a contraction for the moment but also is not so keen on an expansion either.
However, given the current global circumstances, a fast (more reactive) algorithm has been applied which shows that a contraction signal has been given around the top in February 2021 with the previous expansion signal given at the same time as the standard algorithm which is February 2020. The hit ratio of the fast algorithm is 70.96% compared to 74.07% for the standard algorithm.
To summarize, the current state is tilted towards a contracting environment and the next expansion signal is unlikely to occur before at least 5-6 months.
Historical Track Record
As a reminder, the next table shows the historical non-binding track record of the model using the specific back-testing rules described in the introductory post.

Past results are not representative of future results.

8. Bitcoin Tactical Sentiment Index

The Bitcoin Tactical Sentiment Index is a daily sentiment-based indicator which uses insights from volatility, direct surveys, open interest, and patterns to calculate a normalized value that shows where the inflection points are likely to be.
The following signal chart shows the latest 500 observations with the signals.

Commentary
The Bitcoin Tactical Sentiment Index is neutral at the moment with the last signal given in Late January 2022 for an expected 5-day bullish move which showed to last even more.
The index is closer to a bullish signal that to a bearish signal at the moment but nothing is confirmed yet. As it is calculated on a daily basis, if a trigger occurs, an instant update would be sent in the form of a brief post detailing what to expect.
Historical Track Record
As a reminder, the next table shows the historical non-binding track record of the model using the specific back-testing rules described in the introductory post.
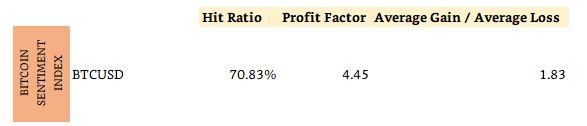
Past results are not representative of future results.

8. Disclosure
Every information contained in the report is solely for the purpose of showing another angle. Since it is not investment advice nor a trade recommendation, you must not use the conclusion of the report as the sole reason for your trading and investing activities. Make sure you know how to include the above elements in your trading framework in a way that does not change your methodology.
Data can have many representations and the information presented is but one side which may be incomplete. All back-testing and forward testing results reflect their own time period and not the future.
The information contained in the report are proprietary and only you must use it. If you have to share it, please state the source correctly by referring the page of Coalescence.