


The Weekly Market Sentiment Report: 19th May - 23rd May 2025
The Weekly Market Sentiment Report: 19/05/2025 - 23/05/2025

CONTENTS
ECONOMIC CALENDAR
MARKET SNAPSHOT
UPCOMING PROJECTS
COT REPORT STRATEGY
PULSECAST SENTIMENT MODEL
SEASONALITY CHARTS
PUT-CALL RATIO
GAMMA EXPOSURE INDEX
VIX
BREATH THRUST INDICATOR
AAII INVESTOR SENTIMENT SURVEY
CRYPTO RSI INDEX
BITCOIN FEAR & GREED INDEX
BITCOIN DOMINANCE CHART
MARKET STRESS INDICATOR
THE COT REPORT STRATEGY TRACK RECORD
DISCLAIMER

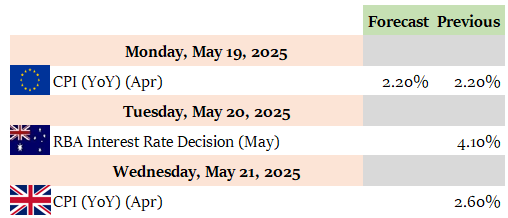
ECONOMIC CALENDAR
An Economic Calendar is a tool used to track and display upcoming economic events, announcements, and indicators that are relevant to financial markets and the broader economy. The following shows what to expect for the coming week:
MARKET SNAPSHOT
The below table summarizes the weekly percentage changes of a few key markets:

This week, EURUSD moved around -0.55 % while equity markets shaped a 5.24 % move as evidenced by the S&P 500 index. Meanwhile, Bitcoin had a -0.35 % move. The safe haven proxy Gold shaped a -4.6 % move. On the fixed income part, Tnote-10 shaped a -0.44 % move. Lastly, Oil had a performance of 2.41 %.
UPCOMING PROJECTS
The following sections are in-progress and will only be added when security checks are performed:
💡A new section about individual U.S stocks: This will feature a number of U.S stocks with a few modern technical indicators and/or patterns in a summarized table/chart.
💡A new section about non-linear global correlations: This will improve the correlation heatmap by adding non-linear correlation measures.
COT REPORT STRATEGY
The CFTC publishes statistics of the futures market on a weekly basis called the Commitment of Traders (COT) Report. The report features the number of futures contracts held by market participants (hedge funds, banks, producers, etc.). Two main categories in the COT report must be distinguished:
Commercial players: They deal in the futures markets for hedging purposes (i.e. to cover their operations or other trading positions). Examples include agricultural giants. Their positions are negatively correlated with the underlying market.
Non-commercial players: They deal in the futures markets for speculative reasons (i.e. to profit from their positions). Examples include hedge funds. Their positions are positively correlated with the underlying market.
The COT report strategy is the core of this report. It highlights the markets that are overbought or oversold with regards to sentiment.
The directional views are represented using the following standards:
⚡ This symbol represents a new tactical directional opportunity.
🔁 This symbol represents an on-going tactical directional opportunity.
✅ This symbol represents a recently closed tactical opportunity at a profit.
❌ This symbol represents a recently closed tactical opportunity at a loss.
⛓️💥 This symbol represents a neutralized opportunity before seeing its target due to conflicting technical elements (if the view is neutralized at a loss compared to its entry price, it will be considered as a loss and will have the loss symbol).
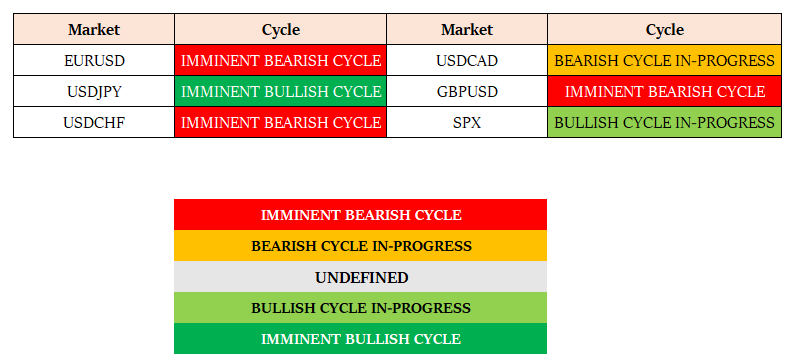
The following summarizes the state of the sentiment for currencies and securities:

The charts are not recommendations, they are just sentiment based opinions:
⚡ BRLJPY: Bullish reaction expected.
⚡ ETHUSD: Bullish reaction expected.
⚡ EURCAD: Bullish reaction expected.
🔁 NASDAQ 100: Bullish reaction expected.
🔁 CHFBRL: Bullish reaction expected.
🔁 AUDZAR: Bearish reaction expected.
🔁 USDCAD: Bullish reaction expected.
🔁 USDJPY: Bullish reaction expected.
✅ EURUSD: Potential seen/reached.
✅ CADJPY: Potential seen/reached.
❌ TNOTE-10: View invalidated.


💡 The views are found by combining different markets together. For example, if EUR has an extremely bearish sentiment and CAD has an extremely bullish sentiment, then a bullish position on EURCAD can be interesting.
💡 The directional views presented must simply be used to help confirm the overall expected direction of the analyzed market. The support and resistance zones are areas of expected reactions (reversals). Some noise may occur around the support and resistance levels.
💡 The track record of the COT report strategy can be found at the end of the newsletter.
The following table summarizes the current state of the sentiment for commodities:
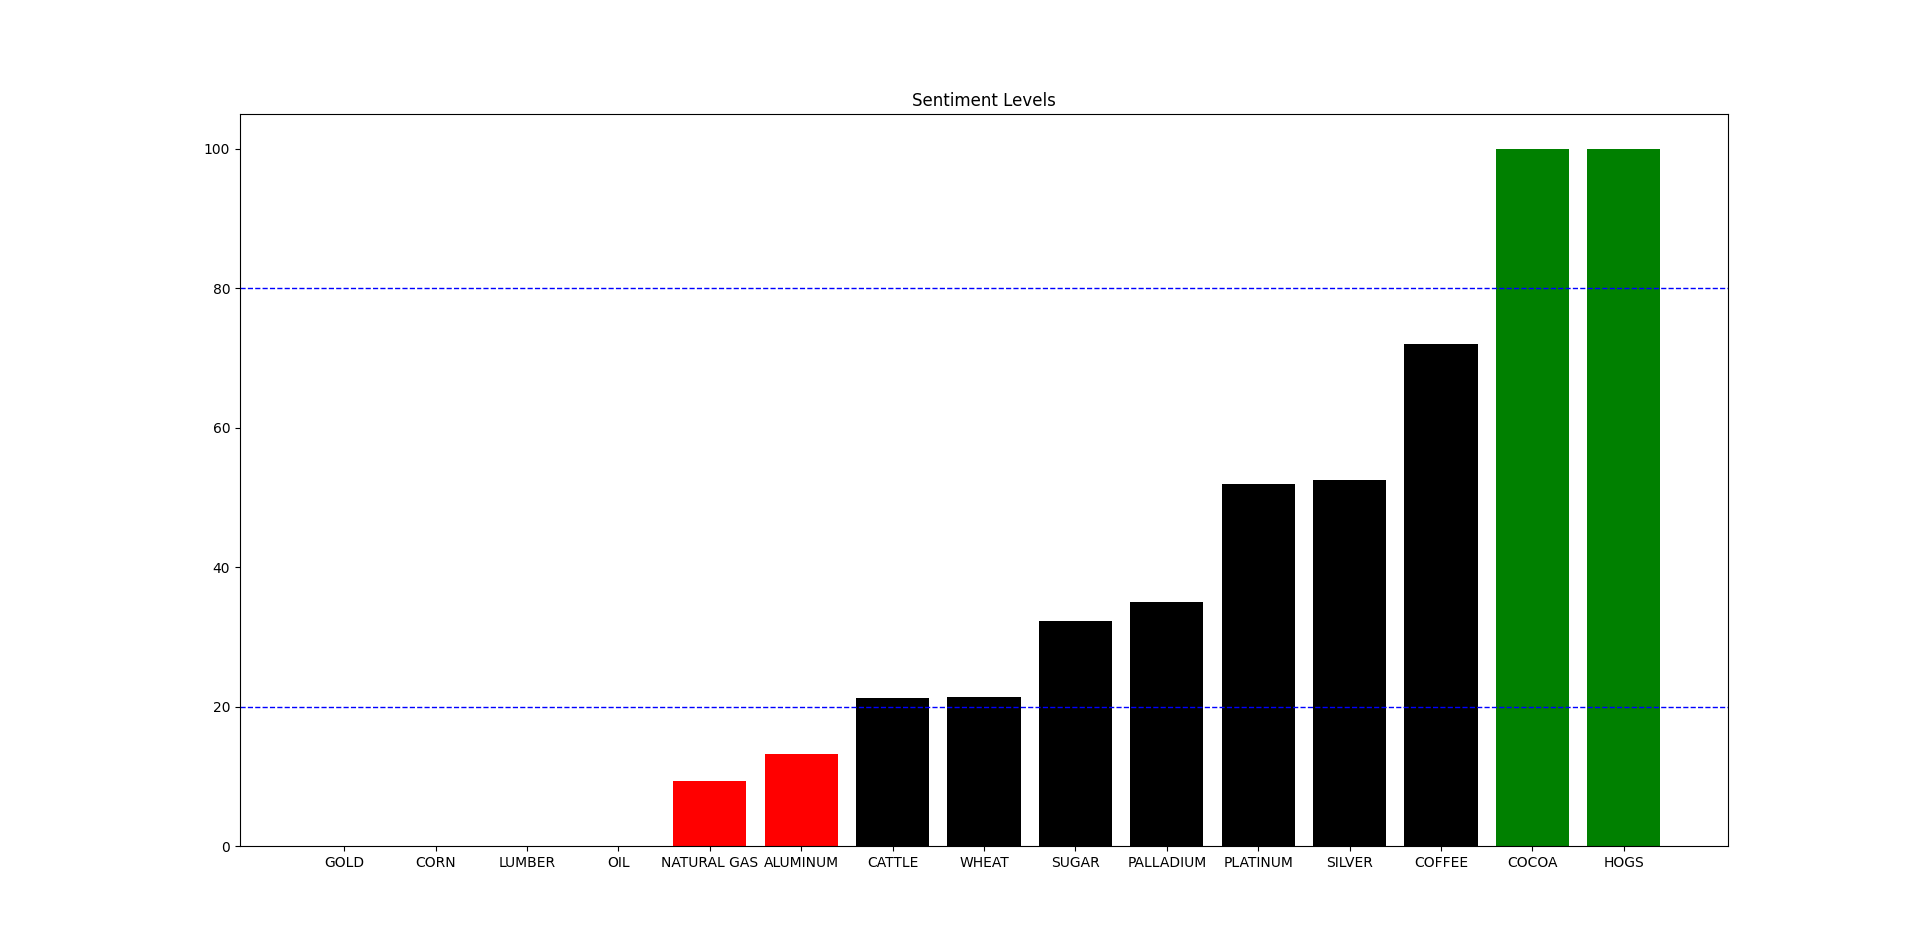
The charts are not recommendations, they are just sentiment based opinions:
⚡ CORN: Bullish reaction expected.
⚡ HOGS: Bearish reaction expected.
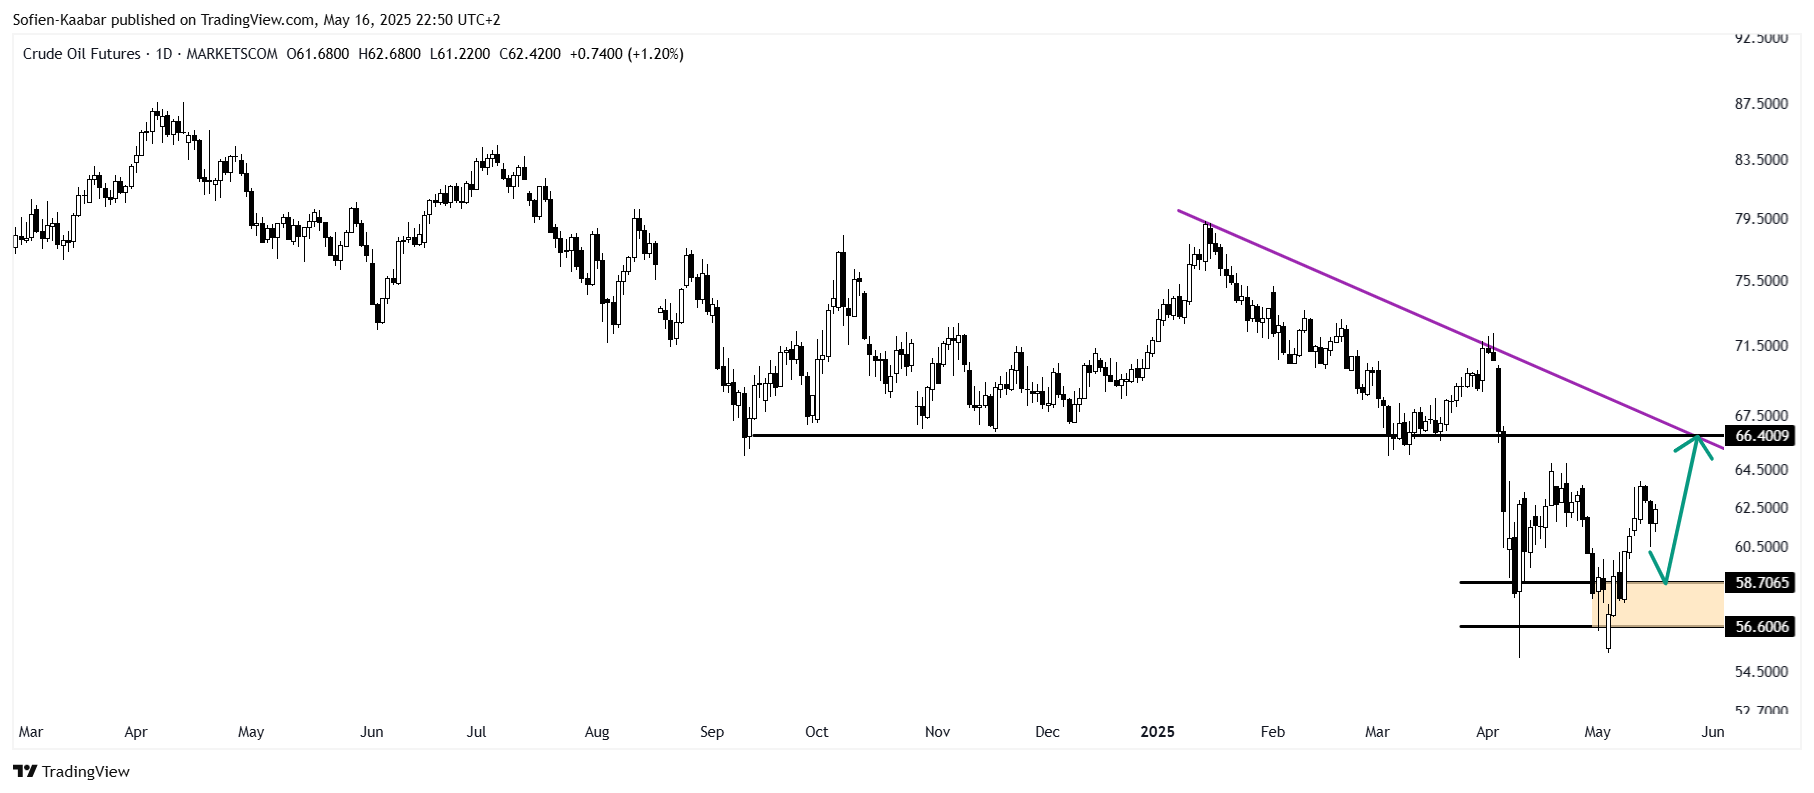
🔁 OIL: Bullish reaction expected.
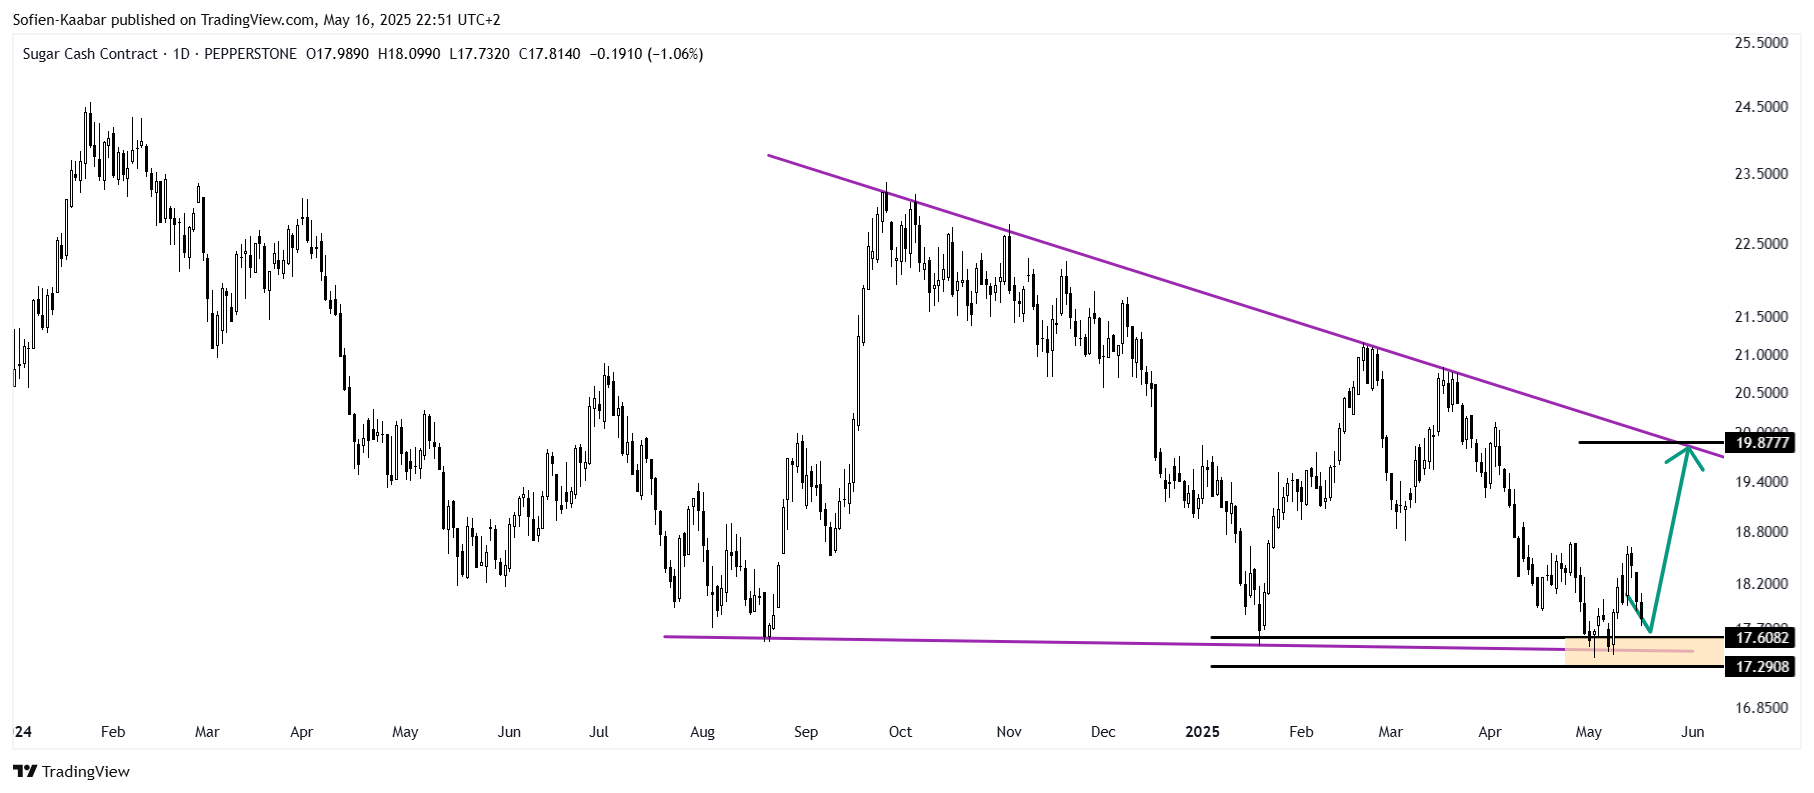
🔁 SUGAR: Bullish reaction expected.
🔁 GOLD: Bullish reaction expected.
✅ ALUMINUM: Potential seen/reached.
❌ COCOA: View invalidated.


PULSECAST SENTIMENT MODEL
This section presents my newest proprietary super sentiment model which has a powerful predictive ability across the markets it targets. It is a combination of the COT report and range analysis. The PulseCast model can only be used on a few markets, and these markets will appear gradually in this section after the Beta mode is over. Here’s how to use the model:
The PulseCast model is an oscillator bounded between 0 and 100. When the model hits 0, a buy signal is generated and when it hits 100, a sell signal is generated.
The model shares a strong correlation with the underlying market it covers.


Interpretation 🔎: The following table summarizes the directional preferences and biases of PulseCast:

SEASONALITY CHARTS
Seasonality charts are comparisons between the average trajectory of a market across the years versus its trajectory this year. It’s generally done by taking the weekly values of an asset over multiple years, then averaging the values for each corresponding week number across all past years (excluding the current year). Afterwards, normalizing the seasonality and current year data so they start at 100 for easy comparison.
The blue line refers to the seasonality. It’s the expected yearly trajectory.
The red line refers to the market’s performance this year so far.

Interpretation 🔎: The following table summarizes the directional preferences and biases of the seasonality charts:
PUT-CALL RATIO
The Equity Put-Call Ratio (PCR), published by the CBOE gives insights to the current market anxiety. It is the number of puts divided by the number of calls. Historically, the correlation with the stock market (S&P 500) has been intuitively negative at ~ -0.40 using the Spearman rank correlation and ~ -0.32 using the Pearson correlation coefficient.

Interpretation 🔎: The scanner is still neutral.
GAMMA EXPOSURE INDEX
The Gamma Exposure Index (GEX) is a measure used in the options market to assess the sensitivity of the market's gamma exposure to price changes. Essentially, gamma provides insight into the convexity or curvature of the option's price in relation to movements in the underlying asset's price.
The GEX quantifies this gamma exposure across a market or a specific underlying asset. A higher GEX suggests a greater sensitivity of the market to price changes, indicating potential volatility due to hedging activities. Conversely, a lower GEX suggests less sensitivity and potentially lower volatility. Here’s how I use the GEX:
A bullish signal is generated whenever the 200-day normalized value of the index reaches the area of around -2.00.

Interpretation 🔎: The GEX is finally exiting the -2.00 area and therefore confirming the recovery of the S&P 500 index. An investing mindset tells us that stocks go up no matter what after a few months/years. So, was this harsh correction just an opportunity to buy and hold? Personally, I believe so.
VIX
The CBOE Volatility Index (VIX) is a popular measure of the stock market's expectation and sentiment of volatility implied by S&P 500 index options. It tends to rise when investors expect significant near-term volatility in the stock market. The VIX is calculated using the prices of a wide range of S&P 500 index options. These prices reflect investors' expectations for future volatility over the next 30 days. Historically, the VIX and the SPX have an inverse relationship.

Interpretation 🔎: The stock market is still recovering after the VIX hit its long-term resistance at 48/54. The chart is still showing potential for more upside on equities.
Do you want to master Deep Learning techniques tailored for time series, trading, and market analysis? My book breaks it all down from basic Machine Learning to complex multi-period LSTM forecasting while going through concepts such as Fractional Differentiation and forecasting thresholds. Get your copy here!
BREADTH THRUST INDICATOR
The Breadth Thrust Indicator is a momentum-based market breadth indicator developed by Marty Zweig, designed to identify the start of strong bullish market moves — especially from deeply oversold conditions. The indicator specifically measures how quickly a large number of stocks shift from a bearish to a bullish posture. Zweig stated that a valid breadth thrust occurs when:
The indicator moves from below 0.40 (deeply oversold) to above 0.615 (strong bullish momentum) within 10 trading days.
This quick shift indicates strong and broad-based buying interest — often seen at the start of bull markets.

Interpretation 🔎: It seems that lately we have had a valid bullish thrust signal after the indicator moved from the oversold territory at 0.40 to 0.615 im less than 10 days. This may signal the resumption of the long-term bullish stock market stance.
AAII INVESTOR SENTIMENT SURVEY
The American Association of Individual Investors (AAII) is a weekly survey that measures the mood of individual investors regarding the direction of the stock market over the next six months. Participants are asked whether they are bullish, bearish, or neutral on the stock market's prospects over the next six months. It is worth mentioning that the AAII survey has a 0.20 correlation with the S&P 500 index.
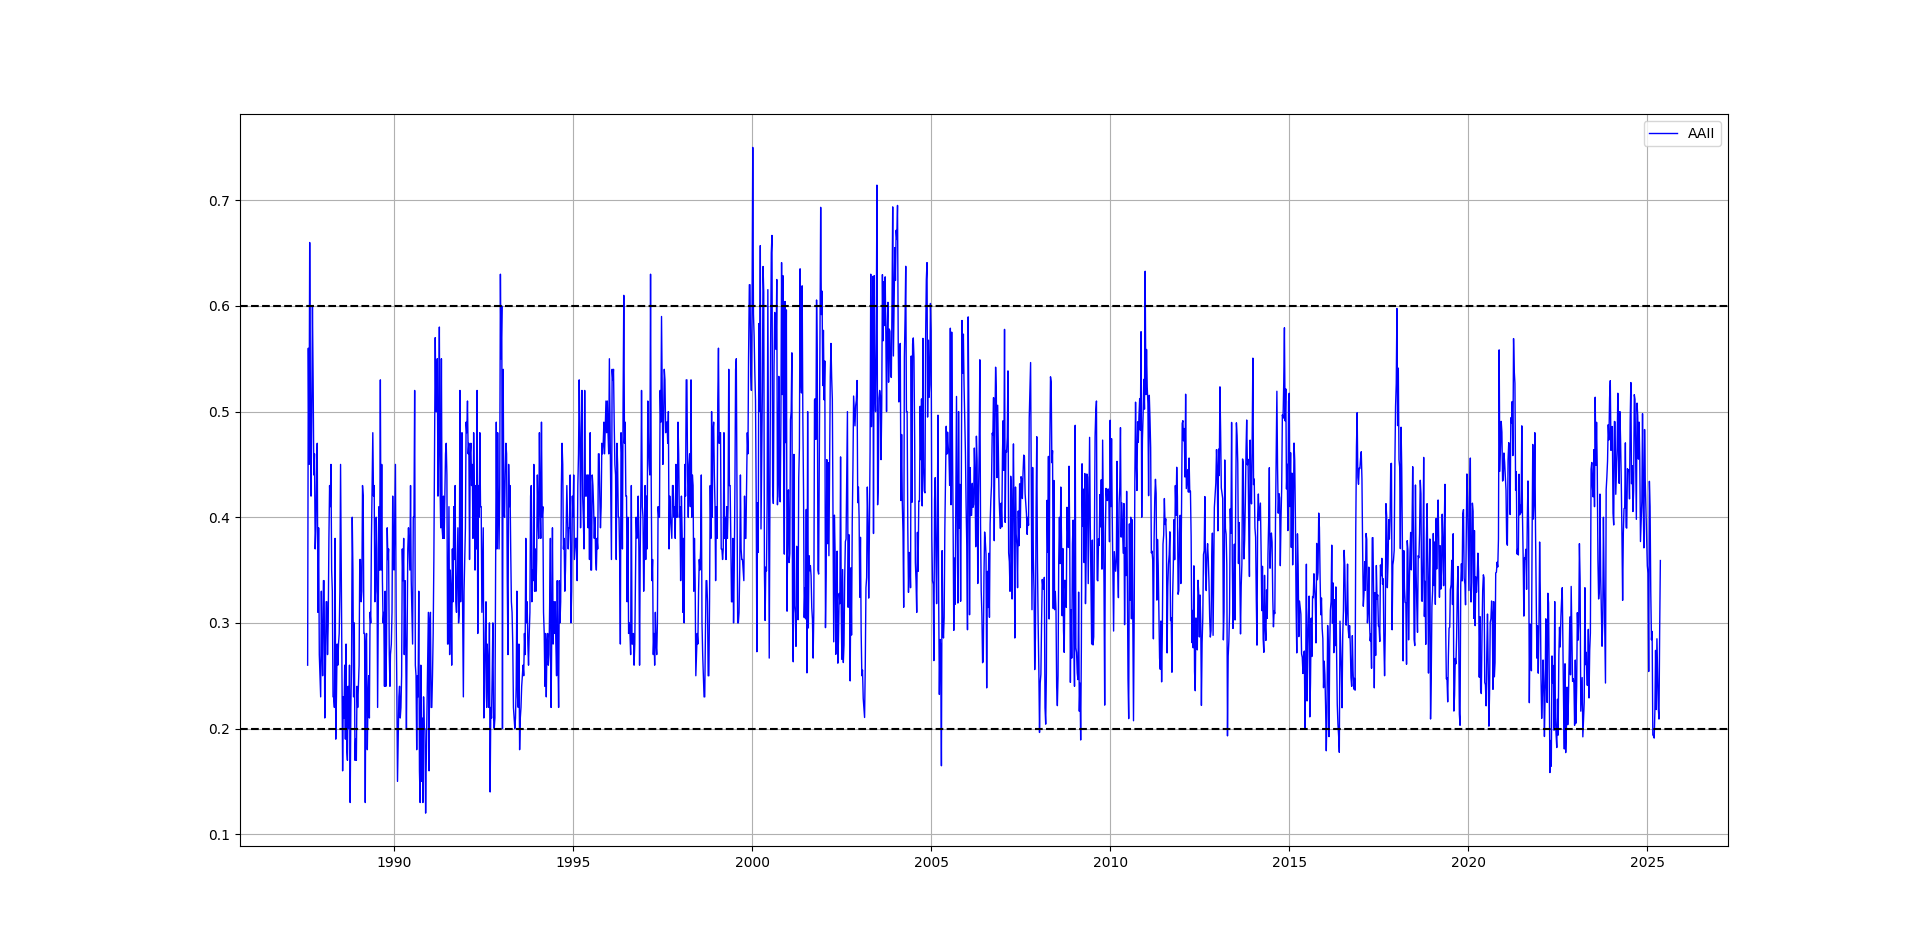
💡 The survey aims to gauge investor sentiment, which can be a useful contrarian indicator. When a high percentage of respondents are bullish, it can indicate market optimism and potentially a market top, while a high percentage of bearish respondents can suggest market pessimism and a potential market bottom.
Interpretation 🔎: The index is still showing a bearish sentiment from the retail community which correlates to a bullish signal on the S&P 500 index.
CRYPTO RSI INDEX
The Crypto RSI Index calculates the number of cryptocurrencies with an RSI above 70 and below 30 and normalizes this figure to give a directional indicator where:
Values below -80 indicate an expected push-up in cryptocurrencies overall and especially BTCUSD.
Values above 80 indicate an expected push-down in cryptocurrencies overall and especially BTCUSD.
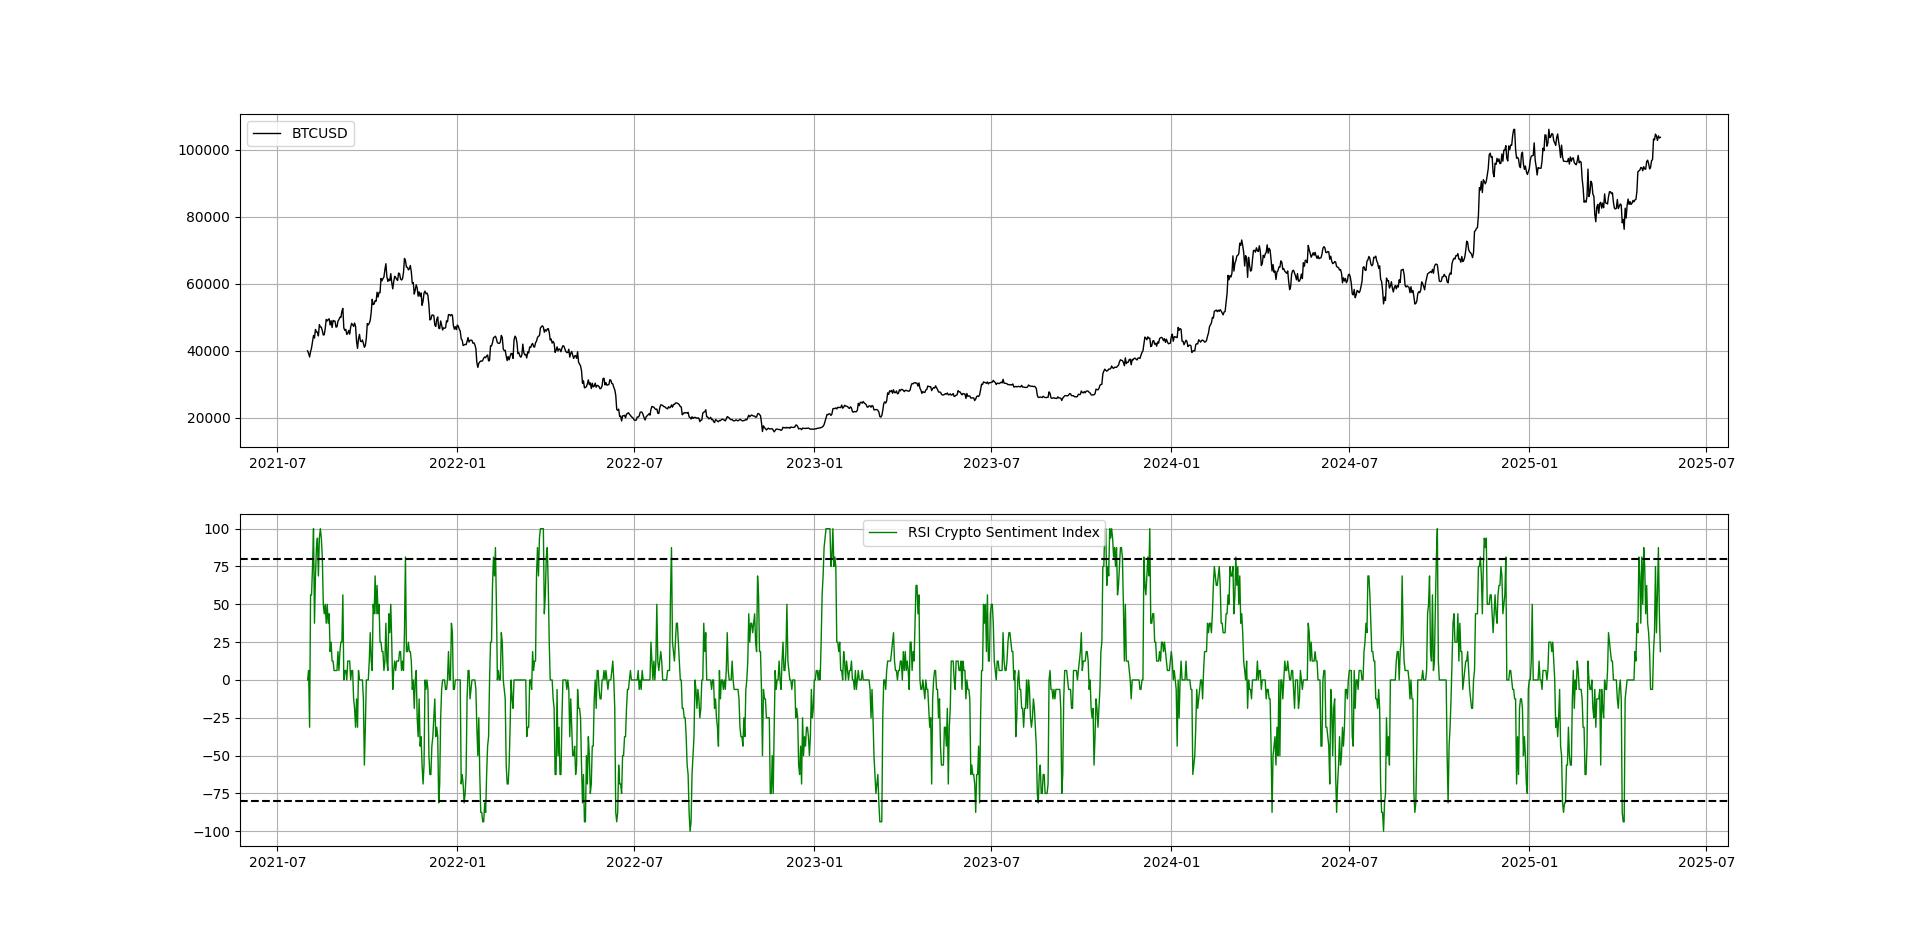
Interpretation 🔎: The correction was very limited as BTCUSD and other altcoins have continued the rally. The index is now back to neutral after failing to predict a meaningful corrective move.
BITCOIN FEAR & GREED INDEX
The Bitcoin Fear and Greed Index is a sentiment analysis tool that measures market emotions toward Bitcoin, ranging from extreme fear to extreme greed. It provides a single value on a scale from 0 to 100, where 0 represents extreme fear and 100 represents extreme greed.
The index is calculated using multiple factors (such as volatility, dominance, social media, survey, etc.) each contributing a percentage to the overall score. It is a contrarian indicator to BTCUSD, but must be used carefully when analyzing it.
Values around a 5 are typically correlated with periods of rising BTCUSD over the coming weeks.
Values around 95 are typically correlated with periods of declining BTCUSD over the coming weeks.
The following chart shows the indicator in action.

Interpretation 🔎: The index is neutral, but is slowly approaching the overbought area.
BITCOIN DOMINANCE CHART
The Bitcoin Dominance Chart represents Bitcoin's market capitalization as a percentage of the total cryptocurrency market capitalization. It helps traders understand capital flow between Bitcoin and altcoins. The following rules of thumb can be used to interpret the Bitcoin dominance:
BTC ↑ + BTC.D ↑: Bitcoin is leading the market, altcoins may struggle.
BTC ↑ + BTC.D ↓: Altcoins are rallying stronger than Bitcoin (altcoin season).
BTC ↓ + BTC.D ↑: Market is in risk-off mode, altcoins are falling faster than BTC.
BTC ↓ + BTC.D ↓: Full market downturn, both BTC and altcoins are struggling.
Additionally, a declining BTC.D suggests a good time to focus on altcoins. When BTC.D rises sharply, reducing altcoin exposure might be wise.

Interpretation 🔎: It seems that altcoins are starting to rally stronger than Bitcoin.
STRESS INDICATOR
The Stress Indicator is a normalized volatility measure that theoretically shares a negative correlation with the market price. Higher stress coincides with falling prices, while lower stress coincides with rising prices.
Values around 0.0 are correlated with higher stress to follow and a fall in market prices.
Values around 1.0 are correlated with lower stress to follow and a rise in market prices.

Interpretation 🔎: Stress is mild in the four main markets above. Gold being the most stressed market at the moment with the S&P 500 seeming to remain stable.
If you want to see more of my work, you can visit my website for the books’ catalogue by simply following this link:
THE COT REPORT STRATEGY TRACK RECORD
You will find in this section the details of the previous COT signals from the COT report strategy. Note that this track record is only for illustrative purposes, it is not supposed to attract or solicit any type of action. It is a bookkeeping way of making sure that the techniques used are still delivering value:

DISCLAIMER
Every information contained in the report is solely for the purpose of showing another angle. Since it is NOT investment advice or trade recommendations, you must NOT use the report as the sole reason for your trading and investing activities.
Trading is fun, enriching, and interesting but not when it comes at the expense of your hard-earned funds. Do not risk what you cannot afford to lose. You must only trade with money you have already considered gone and you must not use trading as your sole revenue generator. Risk management is even more important than the trading strategy itself, make sure to master it..
Data can have many representations and the information presented is but one side of the story which may be incomplete. All back-testing and forward testing results reflect their own time period and not the future as is the case in every research piece.
It seems that hogs futures are bearish, not bullish as stated above