The Weekly Market Sentiment Report: 14th January - 21st January 2024
The Weekly Market Sentiment Report: 14/01/2024- 21/01/2024
CONTENTS
EVOLUTION & NATURE OF THE REPORT
ECONOMIC CALENDAR
CORRELATION HEATMAP
THE COT REPORT - THE LEAD STRATEGY
THE COT REPORT - PATTERN RECOGNITION
THE STRUCTURAL EQUITY SENTIMENT INDEX
THE STRUCTURAL DOLLAR SENTIMENT INDEX
THE EQUITY PUT-CALL RATIO SENTIMENT
GERMANY ZEW ECONOMIC SENTIMENT INDEX
THE ISM PURCHASING MANAGER’S INDEX
THE UNIVERSITY OF MICHIGAN CONSUMER SENTIMENT INDEX
THE LEAD STRATEGY TRACK RECORD
DISCLAIMER
EVOLUTION OF THE REPORT
This report will grow in time due to feedback and new techniques put into place. New sentiment models are constantly added while taking into account their overall utility. Feel free to leave a feedback (e.g. nature of the document, its usefulness, its time interval, its content, language, etc.).
The directional views are represented using the following convention and are followed by their charts:
⚡ This symbol represents a new directional opportunity.
🔁 This symbol represents an on-going directional opportunity.
✅ This symbol represents a recently closed opportunity at a profit.
❌ This symbol represents a recently closed opportunity at a loss.
The directional views presented must simply be used to help confirm the overall expected direction of the analyzed market. The support and resistance zones are not hard levels, they are merely areas of expected reactions (reversals), and hence for risk management purposes, you are advised to place your stops as you see fit. Naturally, when the market clearly breaks the reversal zone, the view is invalidated, however some noise may occur around it before we see a clear reaction.
ECONOMIC CALENDAR
An economic calendar is a tool used in finance and economics to track and display upcoming economic events, announcements, and indicators that are relevant to the financial markets and the broader economy. The following shows what to expect for the coming week.
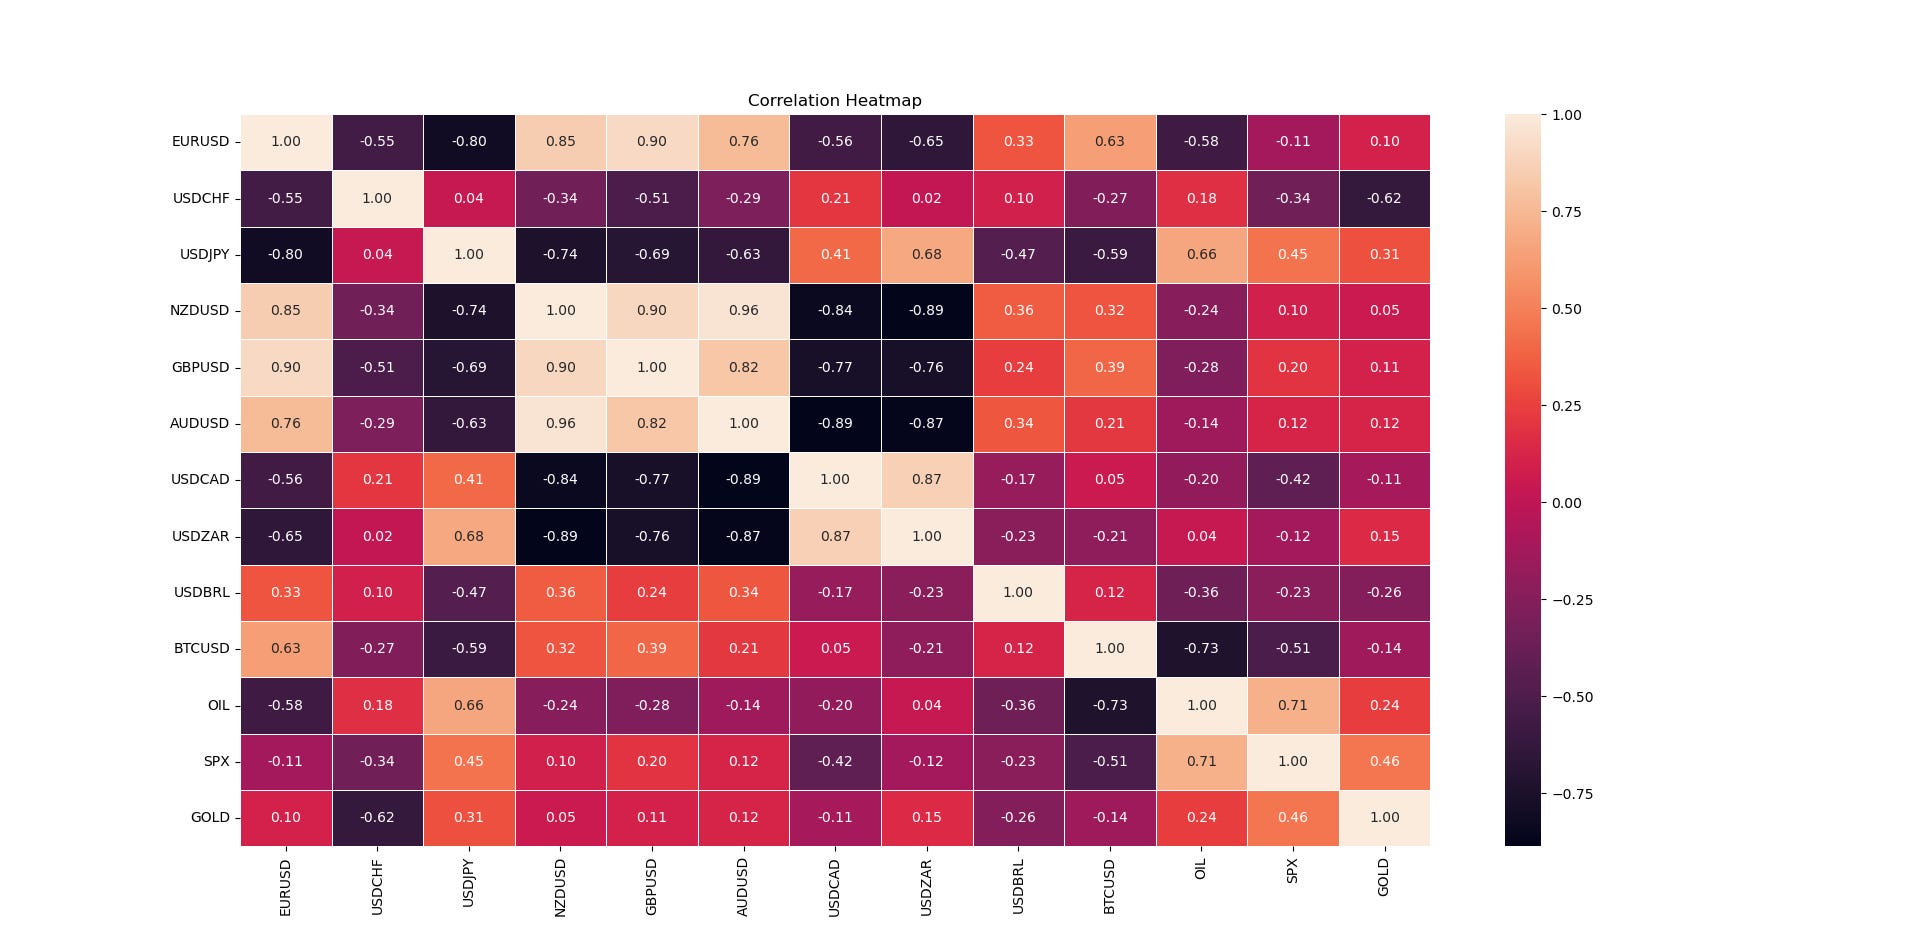
CORRELATION HEATMAP
Correlation is a statistical measure that quantifies the relationship between variables. It measures how closely the returns of two or more assets move together. It ranges from -1 to 1. Understanding the correlations between different markets and asset classes is crucial for managing risk and expectations. The following shows the heatmap between different key markets.
A correlation close to -1.00 implies a negative relationship between the two markets (they move in opposite directions), while a correlation close to 1.00 implies a positive relationship between the two markets (they move in the same direction). Finally, a correlation close to zero implies that there is no linear relationship between the two markets (they may or may not move in the same direction).
THE COT REPORT - THE LEAD STRATEGY
The CFTC publishes statistics of the futures market on a weekly basis called the Commitment of traders (COT) report. The report has many valuable information inside, namely the number of futures contracts held by market participants (hedge funds, banks, producers of commodities, speculators, etc.). Two main categories must be distinguished:
Commercial players: They deal in the futures markets for hedging purposes (i.e. to cover their operations or other trading positions). Examples of hedgers include investment banks and agricultural giants. Their positions are negatively correlated with the underlying market.
Non-commercial players: They deal in the futures markets for speculative reasons (i.e. to profit from their positions). Examples of speculators include hedge funds. Their positions are positively correlated with the underlying market.
The lead strategy is the core of this report. It highlights the markets that are overbought or oversold with regards to sentiment. The key views are found by combining different markets together. For example, if the EUR has an extremely bearish sentiment and the CAD has an overly bullish sentiment, then a bullish position on EURCAD can be interesting if the technicals justify it.
The following table summarizes the current state of the sentiment for FX and IX markets:
Make sure to remember that theses are not advices whatsoever, they are merely charts that fuse sentiment analysis with technical analysis:
⚡ AUDNZD: Bearish move expected around 1.0765/1.0805 to 1.06215.
🔁 CADCHF: Bullish move expected around 0.6195/0.6060 to 0.6555.
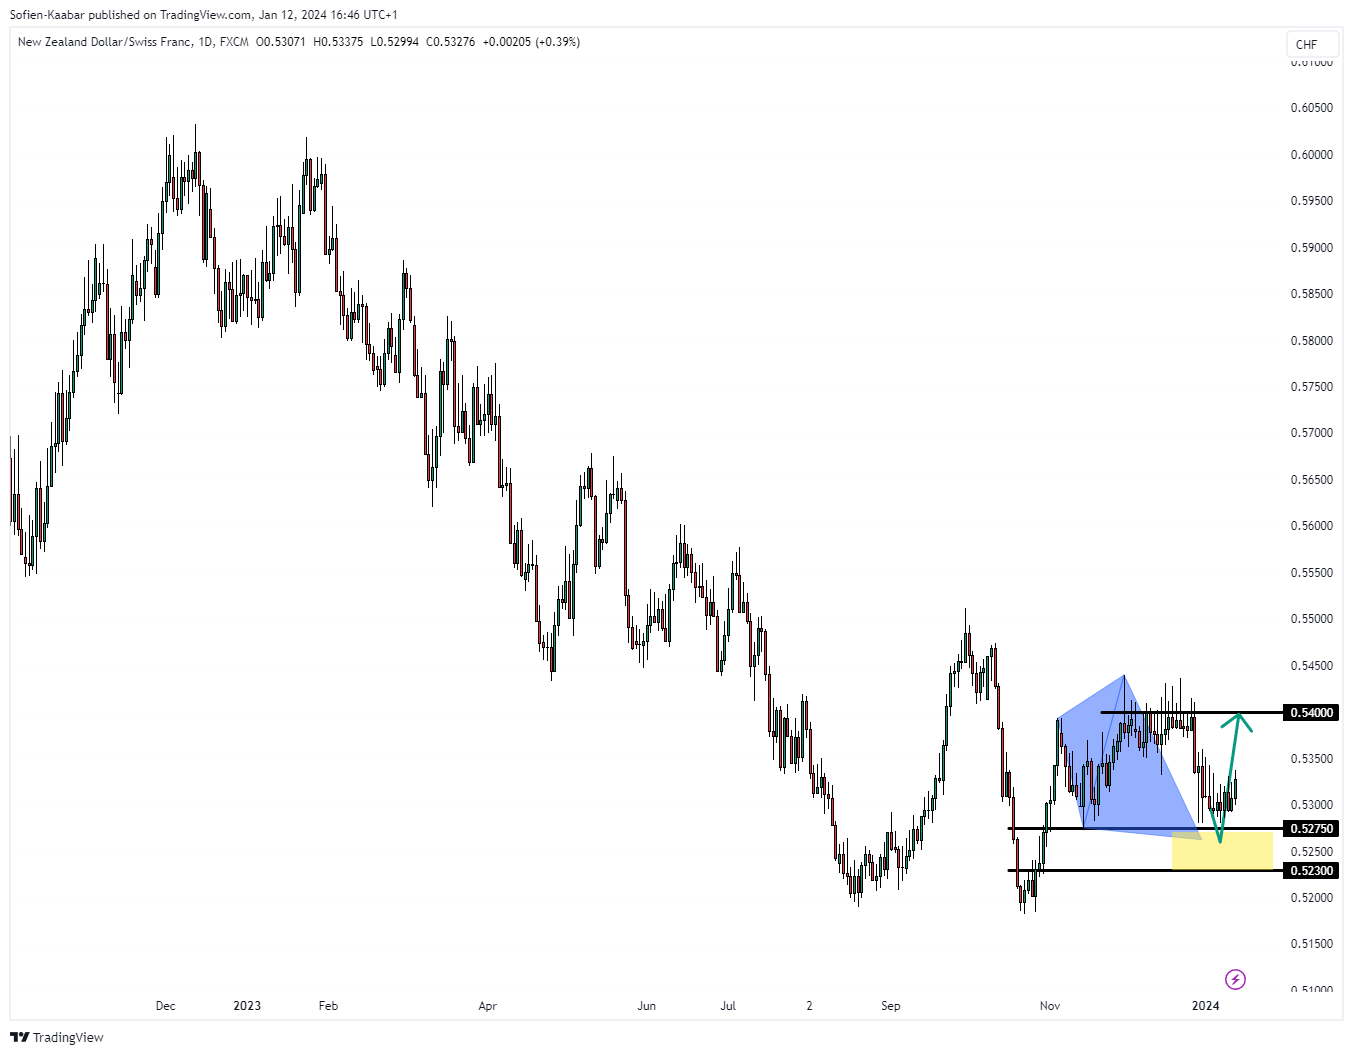
🔁 NZDCHF: Bullish move expected around 0.5275/0.5230 to 0.5400.
✅ CADJPY: Potential reached/approached.
❌ NIKKEI/EEM: View invalidated.
The following table summarizes the current state of the sentiment for commodity markets:
Make sure to remember that theses are not advices whatsoever, they are merely charts that fuse sentiment analysis with technical analysis:
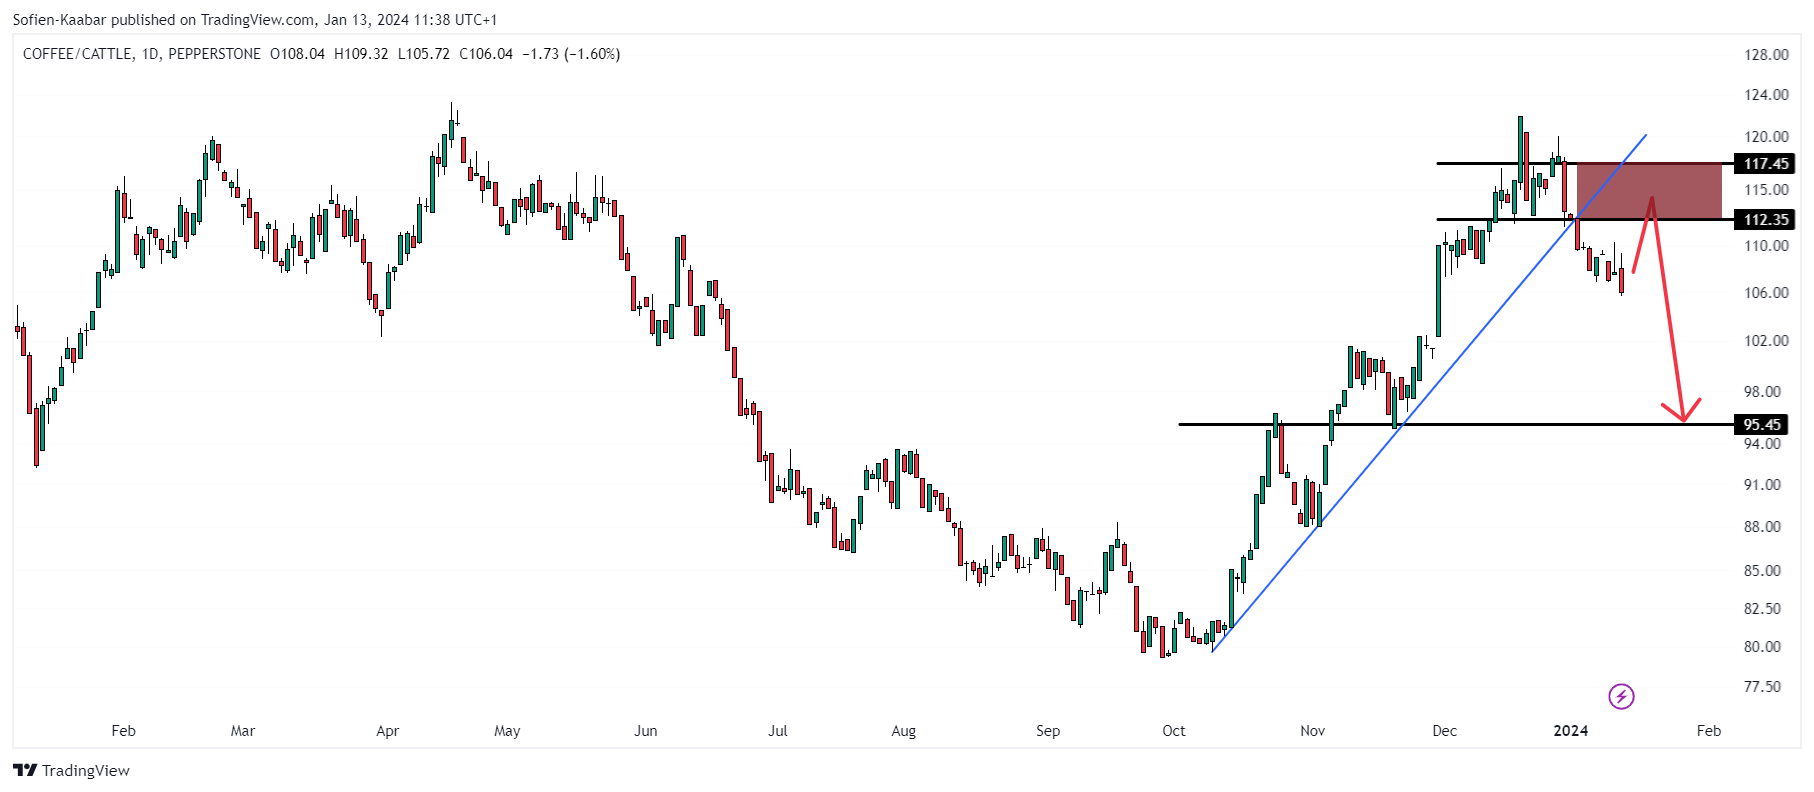
⚡ COFFEE/CATTLE: Bearish move expected around 112.35/117.45 to 95.45.
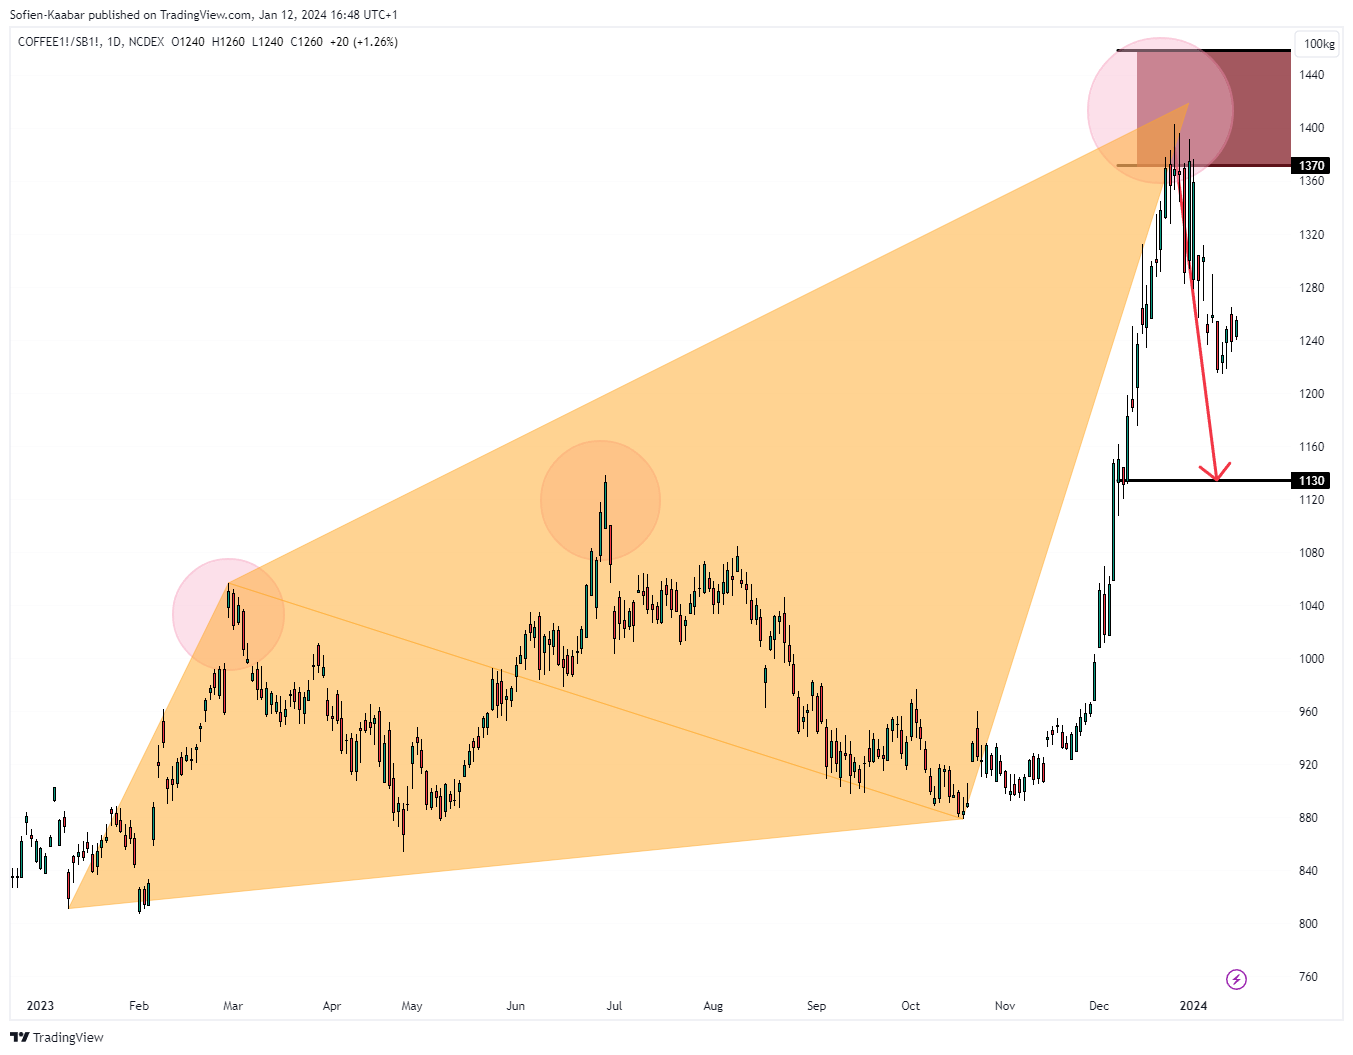
🔁 COFFEE/SUGAR: Bearish move expected around 1370/1445 to 1130.
❌ GOLD/CORN: View invalidated.
✅ SUGAR/PLATINUM: Potential reached/approached.
⚠️ The track record of the lead strategy can be found at the end of the report ⚠️
You can also check out my other newsletter The Weekly Market Analysis Report that sends tactical directional views every weekend to highlight the important trading opportunities using technical analysis that stem from modern indicators. The newsletter is Free.
THE COT REPORT - PATTERN RECOGNITION
Pattern recognition is a cognitive process that involves the identification, organization, and interpretation of patterns or regularities in data, information, or sensory stimuli. It is the ability to recognize and extract meaningful information from complex or noisy input by identifying underlying structures or relationships. This model applies a certain pattern on the COT values in order to predict local tops and bottoms.
Every week, the model scans the universe of the COT values applied on a certain number of markets and outputs the market(s) where the pattern is detected. The underlying hypothesis is that the market is heavily correlated with its COT values and therefore:
A bullish pattern on the COT values imply a bullish signal on the market.
A bearish pattern on the COT values imply a bearish signal on the market.
The following chart summarizes the current state of the pattern recognition system:
Make sure to remember that theses are not advices whatsoever, they are merely charts that fuse sentiment analysis with technical analysis.
Currently, nothing significant from the pattern recognition system.
THE STRUCTURAL EQUITY SENTIMENT INDEX
This index simply calculates the percentage of stocks in the S&P 500 that are above their 50-Day, 100-Day, and 200-Day moving averages. The following shows the evolution of the index versus the S&P 500.
The interpretation of the index is discretionary, but generally high values (close to 90%-100%) are correlated with corrective phases while low values (close to 10%-0%) are correlated with recovery phases.
Conclusion: The index is still at the overbought area and is showing weakening signs with the first reaction having already been seen last week. Bearish bias on US equities.
THE STRUCTURAL DOLLAR SENTIMENT INDEX
This index simply calculates the percentage of the USD major crosses that are above their 50-Day, 100-Day, and 200-Day moving averages. The following shows the evolution of the index versus EURUSD.
The interpretation of the index is discretionary, but generally high values (close to 90%-100%) are correlated with corrective phases while low values (close to 10%-0%) are correlated with recovery phases.
Conclusion: The index is still at the overbought area and is showing weakening signs. This may hint to a bullish USD phase (especially against the EUR). With the pattern recognition system showing a bullish MXN, we may see a bullish opportunity on USDMXN soon.
THE EQUITY PUT-CALL RATIO SENTIMENT
The equity put-call ratio published by the CBOE gives insights to the current market stress. Historically, the correlation with the stock market (S&P 500) has been intuitively negative with around -0.40 correlation using the Spearman rank correlation coefficient (-0.32 correlation given using the Pearson correlation coefficient). Similarly, the maximal information coeffcient (MIC) which measures the degree of non-linear relationship has given 0.20 which suggests there is a relationship between the two time series (whether negative or positive). The following chart shows the current and past signals:
Conclusion: The scanner is showing a bullish signal with a time frame of 5-8 days. This means that from the detection of the signal, the market is expected to move up and end in positive territory after 5-8 days. This is obviously in contradition with the structural equity sentiment index. However, this does not mean that one of the mis wrong as they do not have the same time frame, hence, the SPX may rise as predicted by the PCR model but then start falling as predicted by the sentiment index.
The following chart shows the equity curve of the strategy since inception:
GERMANY ZEW ECONOMIC SENTIMENT INDEX
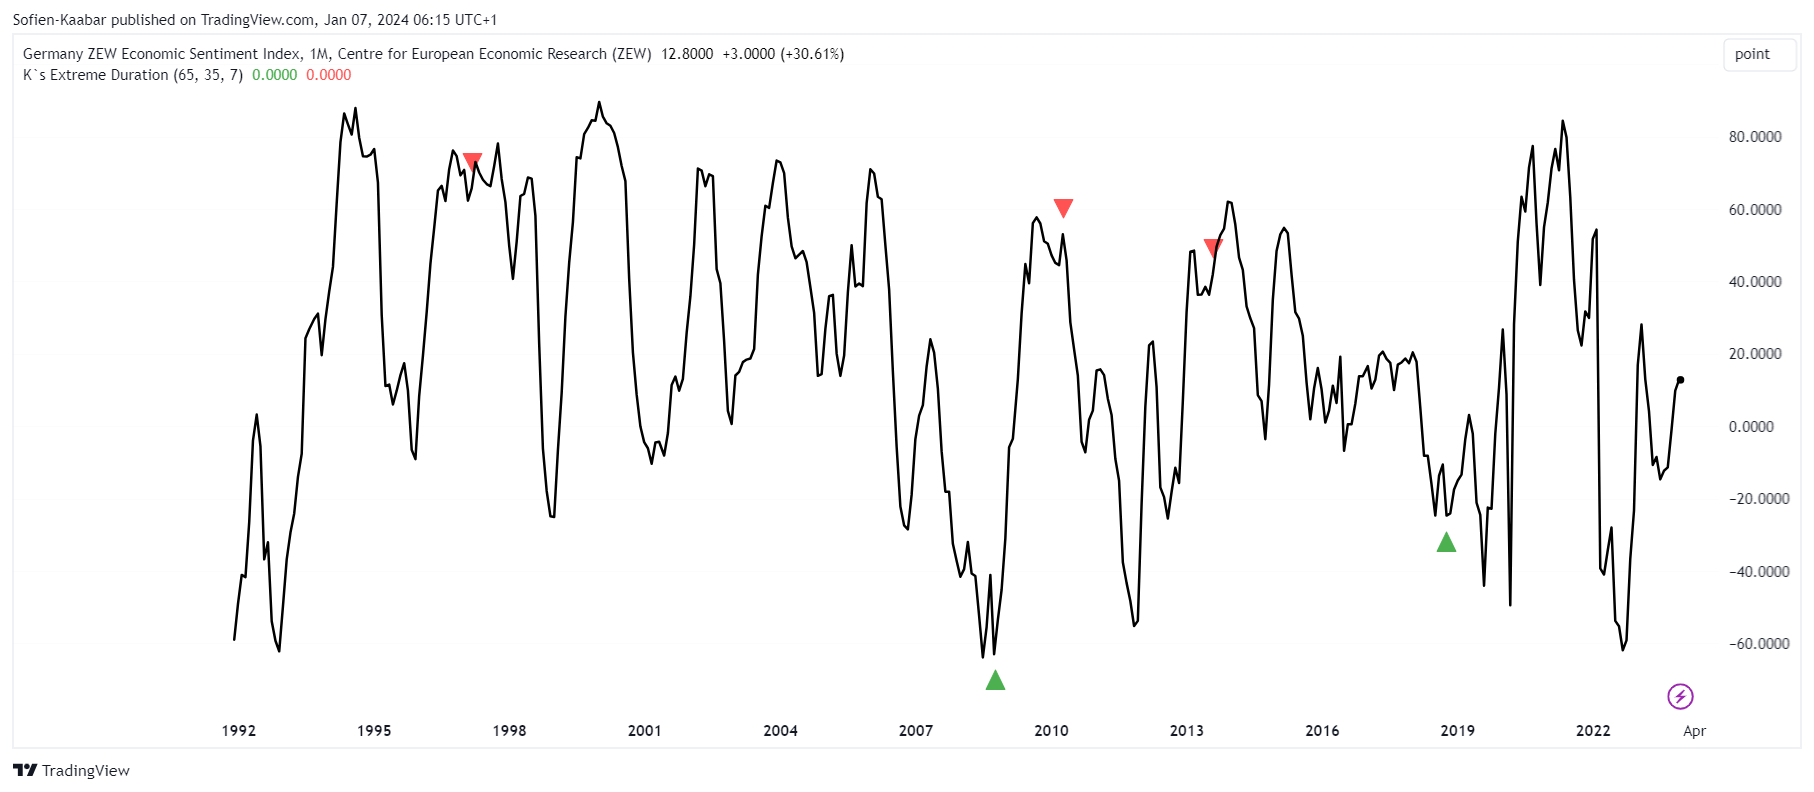
The Germany ZEW economic sentiment index is a widely recognized economic indicator that measures the sentiment or expectations of financial experts and analysts regarding the German economy. The ZEW index is calculated by surveying a panel of around 300 financial experts, including analysts and institutional investors, who are asked to provide their outlook on the German economy for the next six months.
The index is constructed by taking the percentage of positive responses and subtracting the percentage of negative responses. A positive index value indicates optimism and suggests that economic conditions are expected to improve in the near future, while a negative value indicates pessimism and suggests expectations of worsening economic conditions.
The model forecasts the next direction of the index which can be used to trade the direction of EURUSD:
Theoretical expectation: A reaction of 1 month is expected following a signal.
Bear in mind that the Germany ZEW is published on a monthly basis.
THE ISM PMI
The institute for supply management provides a monthly survey called the purchasing manager’s index abbreviated to ISM PMI, which is based on questions asked to 400 representatives of industrial companies about the current and future trend of their different activities. It is composed of 5 components that can also be analyzed individually:
New orders — 30% weight.
Production — 25% weight.
Employment — 20% weight.
Supplier Deliveries — 15% weight.
Inventories — 10% weight.
Typically, we interpret the index as 50 being the neutral state of the economy (neither growing and neither shrinking). A reading above 50 indicates an expansion in manufacturing and a reading below 50 indicates shrinking in manufacturing.
Theoretical expectation: A reaction of 18 months is expected following a signal.
Bear in mind that the ISM PMI is published on a monthly basis.
You can also check out my other newsletter All About Trading! that shares regularly diverse trading articles designed to improve your knowledge of the markets. This is a must-subscribe newsletter!
THE UNIVERSITY OF MICHIGAN CONSUMER SENTIMENT INDEX
The university of Michigan consumer sentiment index (UMCSI) is a measure of consumer confidence or optimism about the economy, as well as their own financial situation. The index is compiled by the University's center and is based on a survey of 500 households conducted each month.
The index is derived from responses to a series of questions regarding consumers' expectations for the economy, inflation, interest rates, employment, and their own financial situation. The responses are scored and weighted, with a higher score indicating greater consumer confidence.
THE LEAD STRATEGY TRACK RECORD
You will find in this section the details of the previous COT signals from the lead strategy. Note that this track record is only for illustrative purposes, it is not supposed to attract or sollicit any type of action. It is a bookkeeping way of making sure that the techniques used are still delivering value:
All these views can be verified by accessing the previous newsletter in the homepage. The hit ratio is calculated using the directional method. This means that the moment the analysis published, an entry is assumed. If the target has been approached or attained, then the view is recorded as a good forecast. Otherwise, if the market clearly breaks the reaction area (support or resistance), it is recorded as a bad forecast.
Do not hesitate to share your thoughts and forecasts in the comment section.
DISCLAIMER
Every information contained in the report is solely for the purpose of showing another angle. Since it is NOT investment advice or trade recommendations, you must NOT use the report as the sole reason for your trading and investing activities.
Trading is fun, enriching, and interesting but not when it comes at the expense of your hard-earned funds. Do not risk what you cannot afford to lose. You must only trade with money you have already considered gone and you must not use trading as your sole revenue generator. Risk management is even more important than the trading strategy itself, make sure to master it.
Data can have many representations and the information presented is but one side of the story which may be incomplete. All back-testing and forward testing results reflect their own time period and not the future as is the case in every research piece.


