


The Weekly Market Sentiment Report: 21st April - 25th April 2025
The Weekly Market Sentiment Report: 21/04/2025 - 25/04/2025

CONTENTS
ECONOMIC CALENDAR
MARKET SNAPSHOT
UPCOMING PROJECTS
THE COT REPORT STRATEGY
THE PULSECAST SENTIMENT MODEL
THE GAMMA EXPOSURE INDEX
VIX
SECTOR ROTATION GRAPH
THE AAII INVESTOR SENTIMENT SURVEY
THE CRYPTO RSI INDEX
BITCOIN FEAR & GREED INDEX
BITCOIN DOMINANCE CHART
MARKET STRESS INDICATOR
INFLATION RATE MID-TERM MODEL
THE COT REPORT STRATEGY TRACK RECORD
DISCLAIMER

ECONOMIC CALENDAR
An Economic Calendar is a tool used to track and display upcoming economic events, announcements, and indicators that are relevant to financial markets and the broader economy. The following shows what to expect for the coming week:

MARKET SNAPSHOT
The below table summarizes the weekly percentage changes of a few key markets:
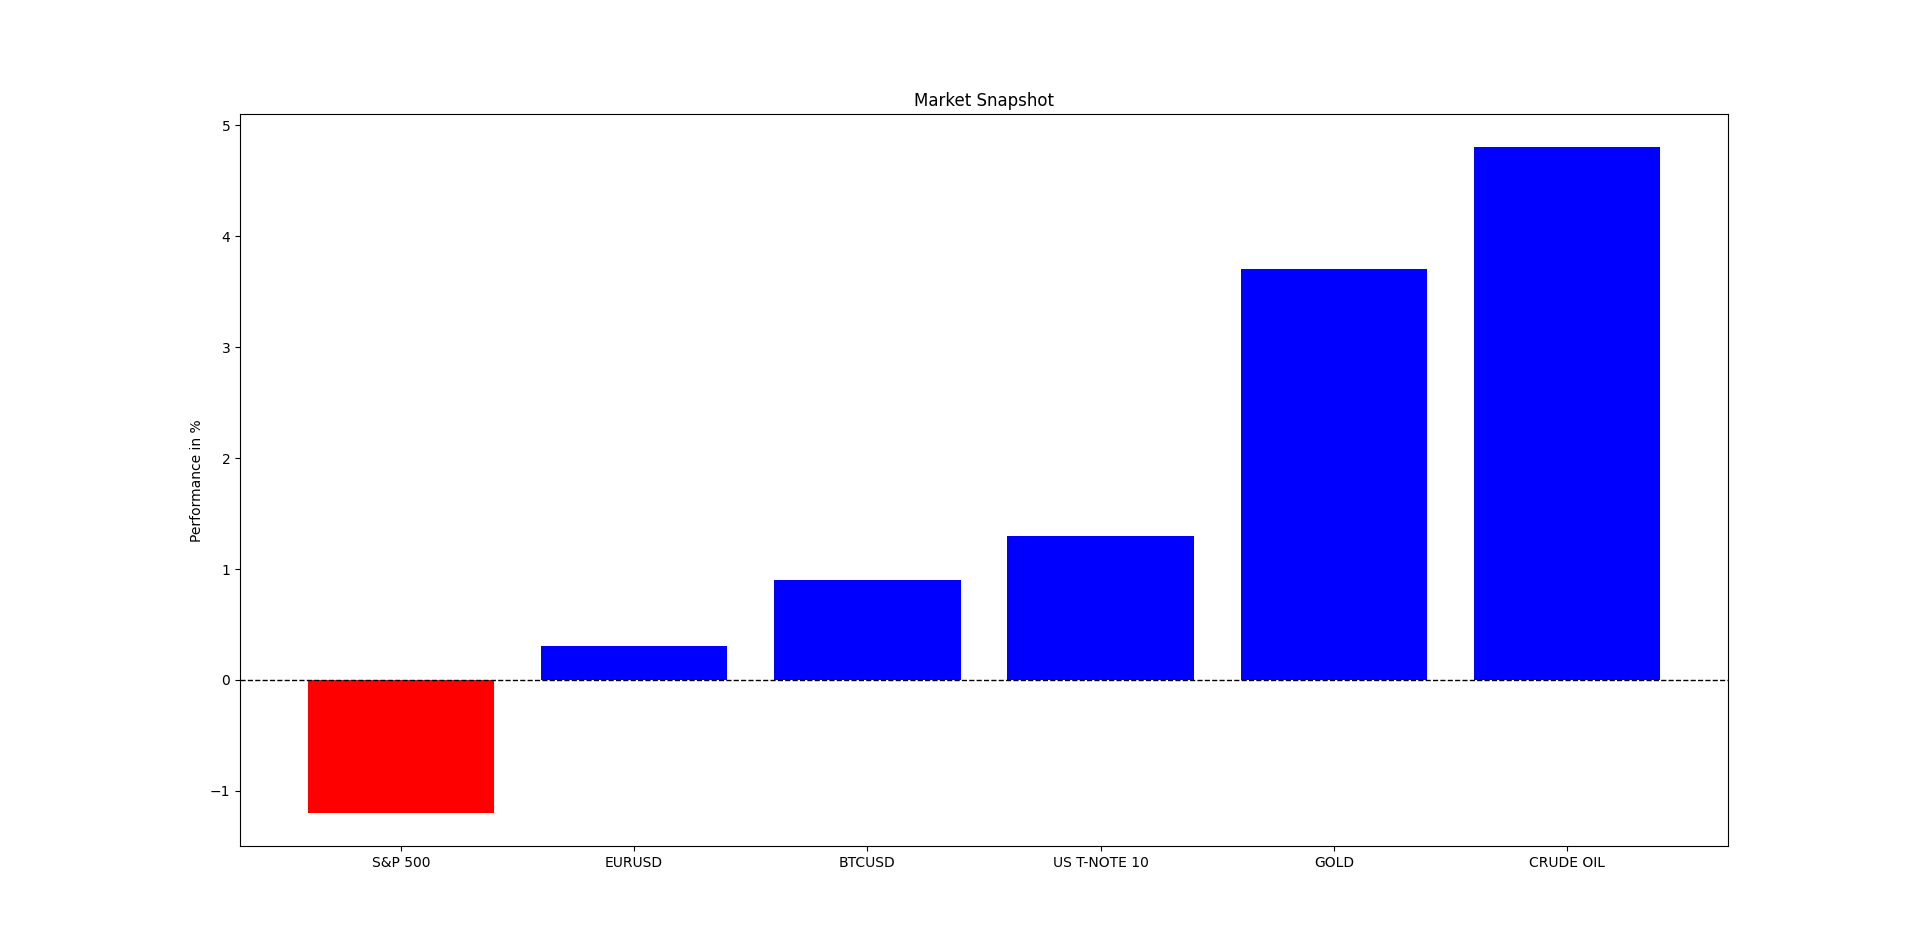
This week, EURUSD moved around 0.31 % while equity markets shaped a -1.2 % move as evidenced by the S&P 500 index. Meanwhile, Bitcoin had a 0.9 % move. The safe haven proxy Gold shaped a 3.7 % move. On the fixed income part, Tnote-10 shaped a 1.3 % move. Lastly, Oil had a performance of 4.8 %.
UPCOMING PROJECTS
The following sections are in-progress and will only be added when security checks are performed:
💡A new section about individual U.S stocks: This will feature a number of U.S stocks with a few modern technical indicators and/or patterns in a summarized table/chart.
💡A new section about seasonality of markets through time: This will feature a type of averaging of a few key markets that will show the expected trajectory for each year. Larry Williams uses this in his reports.
💡A new section about non-linear global correlations: This will improve the correlation heatmap by adding non-linear correlation measures.
💡A revised section about the put-call ratio: This will improve the interpretability and visibility of the PCR model.
THE COT REPORT STRATEGY
The CFTC publishes statistics of the futures market on a weekly basis called the Commitment of Traders (COT) Report. The report features the number of futures contracts held by market participants (hedge funds, banks, producers, etc.). Two main categories in the COT report must be distinguished:
Commercial players: They deal in the futures markets for hedging purposes (i.e. to cover their operations or other trading positions). Examples include agricultural giants. Their positions are negatively correlated with the underlying market.
Non-commercial players: They deal in the futures markets for speculative reasons (i.e. to profit from their positions). Examples include hedge funds. Their positions are positively correlated with the underlying market.
The COT report strategy is the core of this report. It highlights the markets that are overbought or oversold with regards to sentiment.
The directional views are represented using the following standards:
⚡ This symbol represents a new tactical directional opportunity.
🔁 This symbol represents an on-going tactical directional opportunity.
✅ This symbol represents a recently closed tactical opportunity at a profit.
❌ This symbol represents a recently closed tactical opportunity at a loss.
⛓️💥 This symbol represents a neutralized opportunity before seeing its target due to conflicting technical elements (if the view is neutralized at a loss compared to its entry price, it will be considered as a loss and will have the loss symbol).
The following summarizes the state of the sentiment for currencies and securities:

The charts are not recommendations, they are just sentiment based opinions:
Keep reading with a 7-day free trial
Subscribe to The Weekly Market Sentiment Report to keep reading this post and get 7 days of free access to the full post archives.