


The Weekly Market Sentiment Report: 2nd April - 9th April 2023
The Weekly Market Update: 02/04/2023 - 09/04/2023


CONTENTS
THE PUT-CALL RATIO SENTIMENT STRATEGY
THE GAMMA EXPOSURE INDEX (THE WHITE INDEX)
THE AMERICAN ASSOCIATION OF INDIVIDUAL INVESTORS
THE COMMITMENT OF TRADERS REPORT: NORMALIZED VALUES
BITCOIN’S FEAR AND GREED STRATEGY
THE ISM PMI: THE CEO’S SENTIMENT
THE UNIVERSITY OF MICHIGAN CONSUMER SENTIMENT INDEX
THE MONTHLY CANDLESTICK SENTIMENT OPINION
FUTURE INDICATORS
DISCLAIMER
ECONOMIC CALENDAR

THE PUT-CALL RATIO SENTIMENT STRATEGY
The equity put-call ratio published by the CBOE gives insights to the current market stress. Historically, the correlation with the stock market (S&P 500) has been intuitively negative with around -0.40 correlation using the Spearman rank correlation coefficient (with -0.32 correlation given using the Pearson correlation coefficient). Similarly, the maximal information coeffcient (MIC) which measures the degree of non-linear relationship has given 0.20 which suggests there is a relationship between the two time series (whether negative or positive).
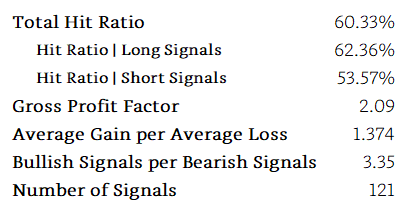
The strategy uses a type of mean-reversion technique on the put-call ratio to derive signals. The performance of the sentiment model is found below.

Conclusion: The sentiment scanner is looking for the next signal since giving a bullish signal a few days ago which has seen its potential. Keep in mind that this is a daily indicator. The latest observation is 01/04/2023.
Historical Performance

THE GAMMA EXPOSURE INDEX (THE WHITE INDEX)
The Gamma Exposure Index (GEI), a proprietary indicator created by financial analytics firm Squeeze Metrics. A stock's or other financial asset's exposure to fluctuations in the general market or benchmark index, usually the S&P 500, is measured by its GEI. The GEI, to put it simply, assesses how sensitive a stock's returns are to fluctuations in the market. A stock's returns are thought to be more closely correlated with market movements if the GEI is higher, whereas the opposite is true if the GEI is lower. Squeeze Metrics employs GEI to shed light on a stock's or portfolio's risk profile and point out potential avenues for diversification or risk management. Historically, the GEI is correlated with the S&P 500 (around 0.30 across all three different correlation metrics).
Keep reading with a 7-day free trial
Subscribe to The Weekly Market Sentiment Report to keep reading this post and get 7 days of free access to the full post archives.