
The Weekly Market Sentiment Report: 11th August - 14th August 2025
The Weekly Market Sentiment Report: 11/08/2025 - 14/08/2025


CONTENTS
ECONOMIC CALENDAR
MARKET SNAPSHOT
COT REPORT —————————
COT REPORT MAIN STRATEGY
COT REPORT PULSECAST MODEL
EQUITY SENTIMENT MODELS —————————
STOCK RECOMMENDATION MODEL 🆕
AAII INVESTOR SENTIMENT SURVEY
PUT-CALL RATIO MONITOR 🆕
CRYPTOCURRENCY SENTIMENT MODELS —————————
BITCOIN FEAR & GREED INDEX
CRYPTO RSI INDEX
SEASONALITY CHARTS —————————
YEARLY SEASONALITY CHARTS
WEEKLY SEASONALITY CHARTS 🆕
TECHNICAL CHARTS —————————
BITCOIN TECHNICAL CHART 🆕
S&P 500 TECHNICAL CHART 🆕
EURUSD TECHNICAL CHART 🆕
DISCLAIMER

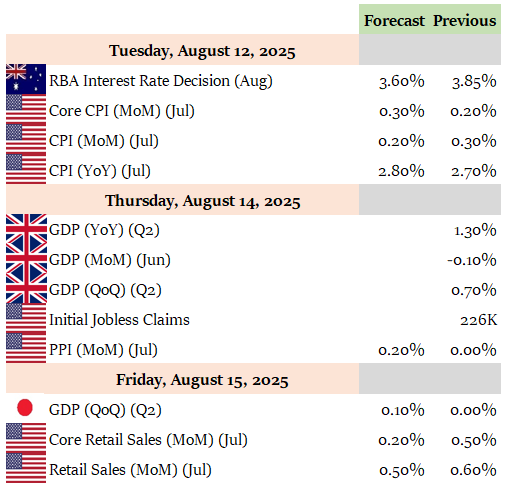
ECONOMIC CALENDAR
An Economic Calendar is a tool used to track and display upcoming economic events, announcements, and indicators that are relevant to financial markets and the broader economy. The following shows what to expect for the coming week:
MARKET SNAPSHOT
The below table summarizes the weekly percentage changes of a few key markets:
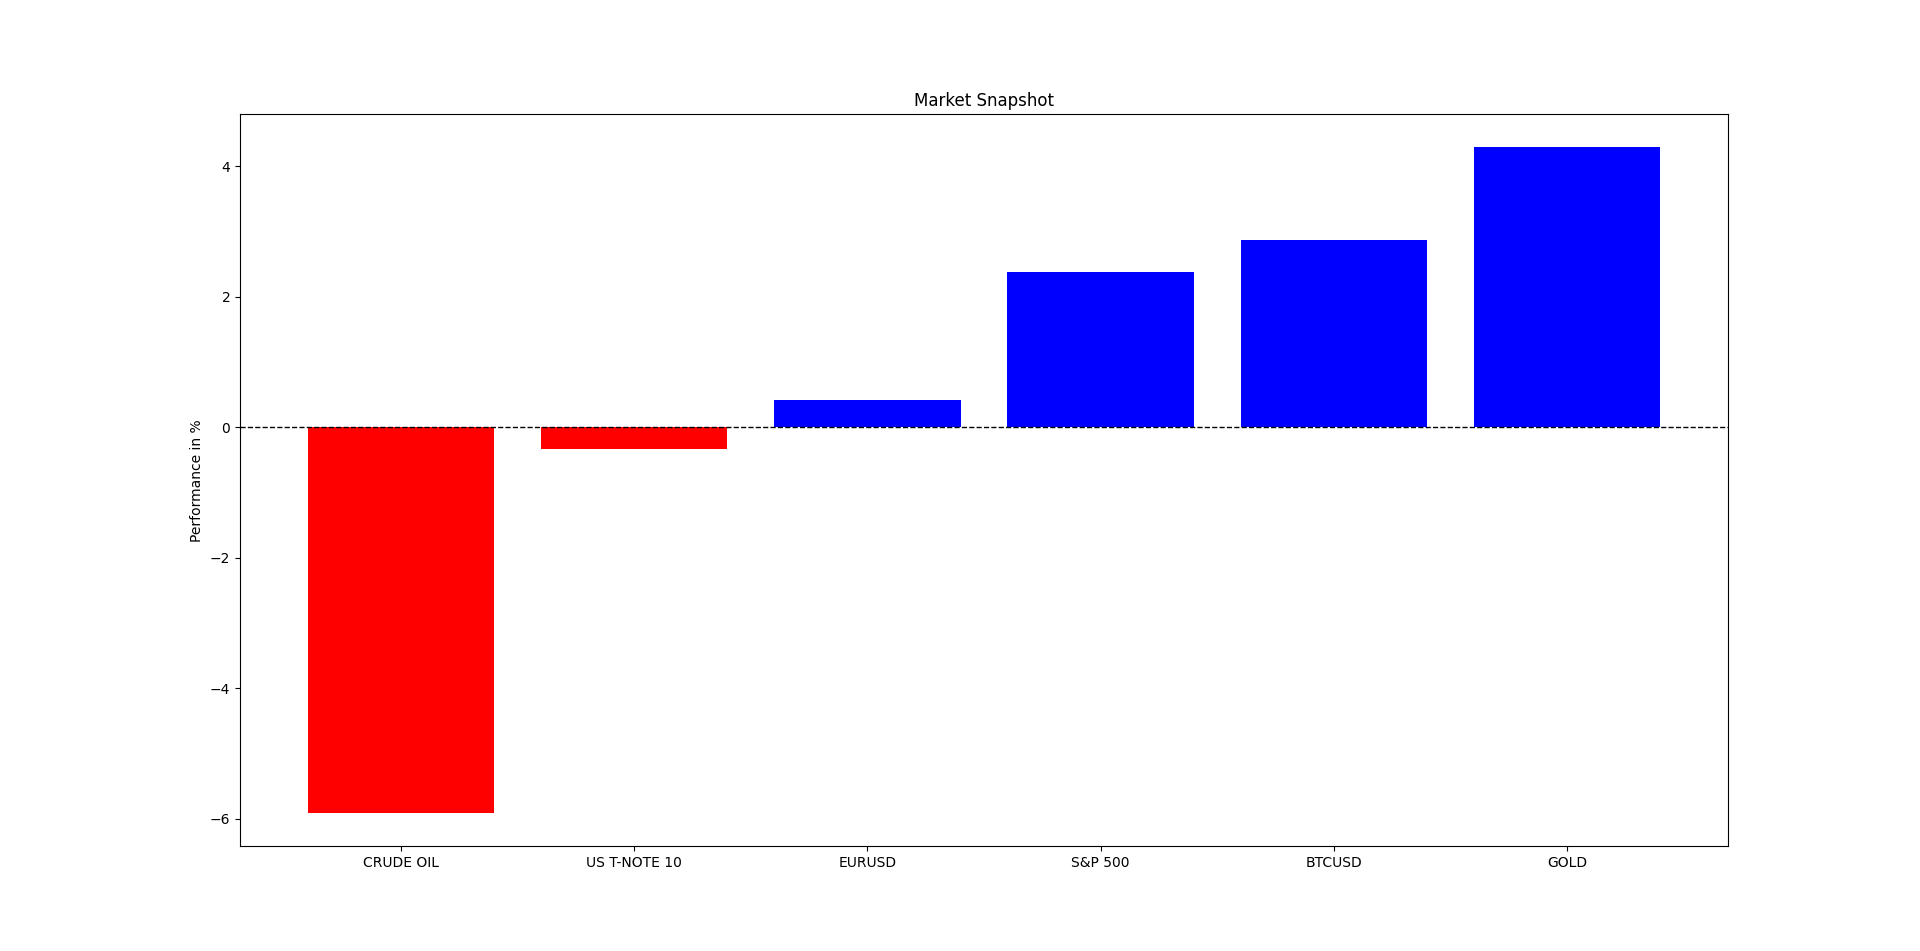
This week, EURUSD moved around 0.42 % while equity markets shaped a 2.38 % move as evidenced by the S&P 500 index. Meanwhile, Bitcoin had a 2.87 % move. The safe haven proxy Gold shaped a 4.29 % move. On the fixed income part, Tnote-10 shaped a -0.33 % move. Lastly, Oil had a performance of -5.91 %.
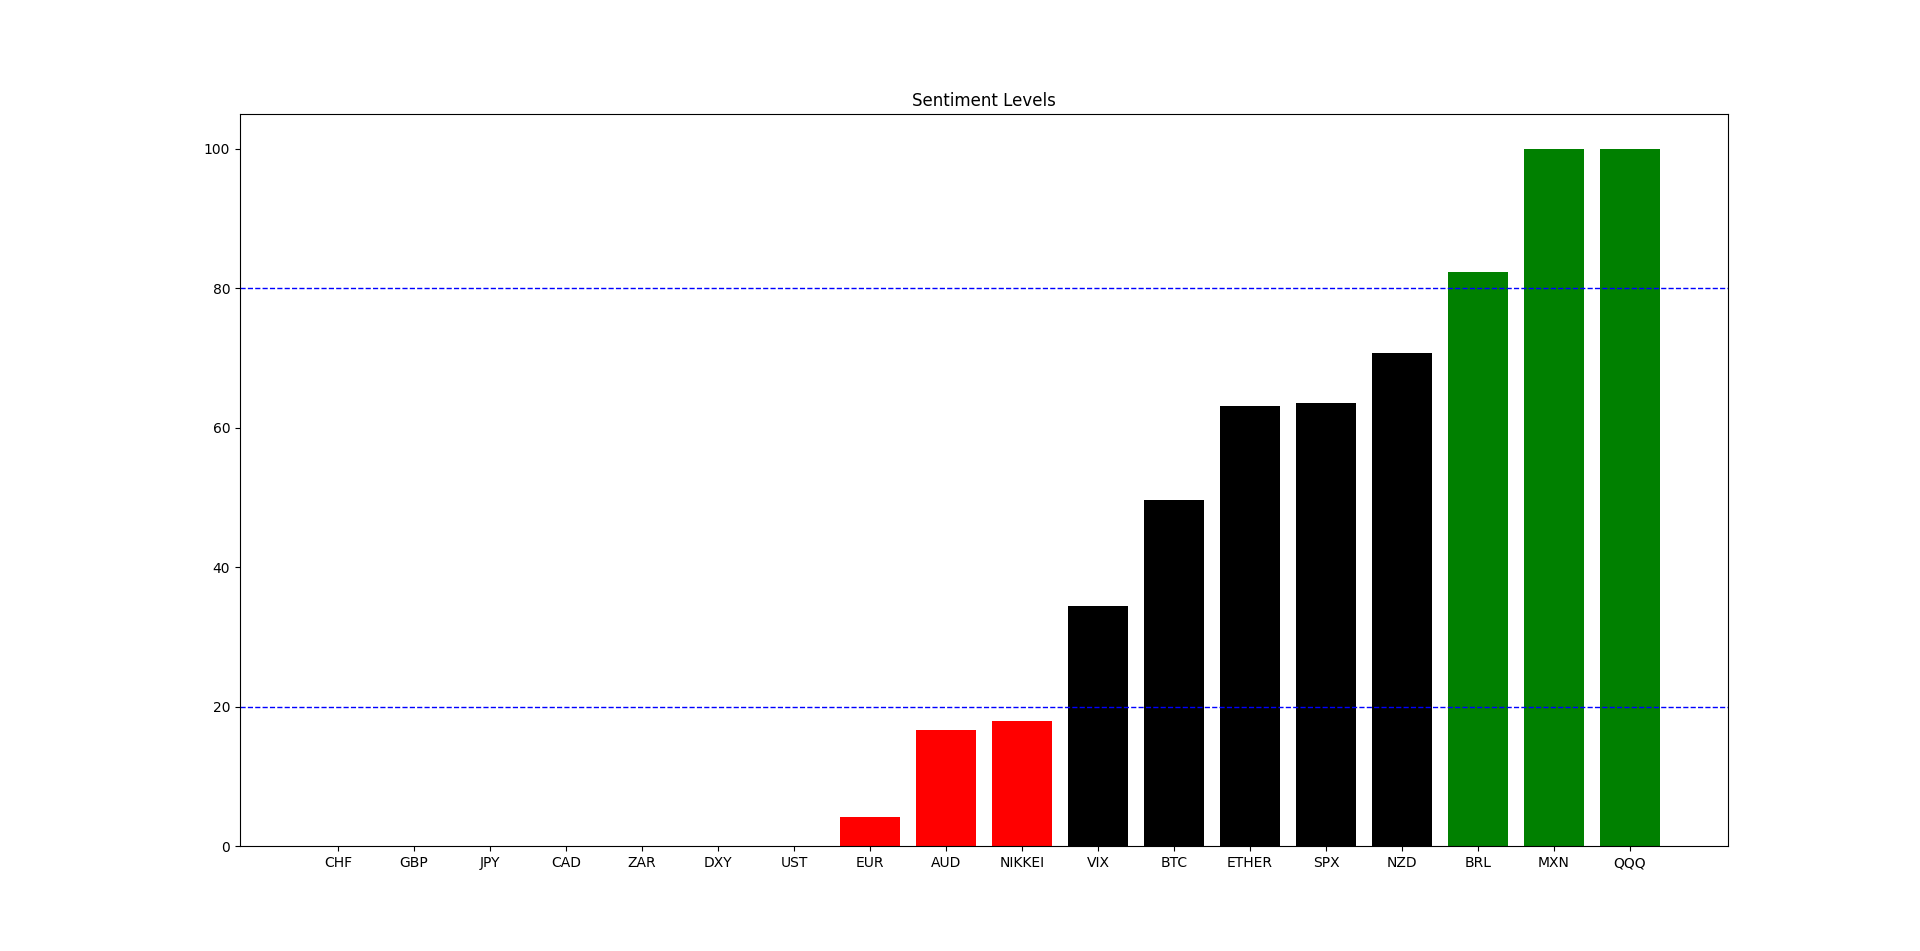
COT REPORT MAIN STRATEGY
The CFTC publishes statistics of the futures market on a weekly basis called the Commitment of Traders (COT) Report. The report features the number of futures contracts held by market participants (hedge funds, banks, producers, etc.). Two main categories in the COT report must be distinguished:
Commercial players: They deal in the futures markets for hedging purposes (i.e. to cover their operations or other trading positions). Examples include agricultural giants. Their positions are negatively correlated with the underlying market.
Non-commercial players: They deal in the futures markets for speculative reasons (i.e. to profit from their positions). Examples include hedge funds. Their positions are positively correlated with the underlying market.
The COT report strategy is the core of this report. It highlights the markets that are overbought or oversold with regards to sentiment.
The directional views are represented using the following standards:
⚡ This symbol represents a new tactical directional opportunity.
🔁 This symbol represents an on-going tactical directional opportunity.
✅ This symbol represents a recently closed tactical opportunity at a profit.
❌ This symbol represents a recently closed tactical opportunity at a loss.
⛓️💥 This symbol represents a neutralized opportunity before seeing its target due to conflicting technical elements (if the view is neutralized at a loss compared to its entry price, it will be considered as a loss and will have the loss symbol).
The following summarizes the state of the sentiment for currencies and securities:
The charts are not recommendations, they are just sentiment based opinions:
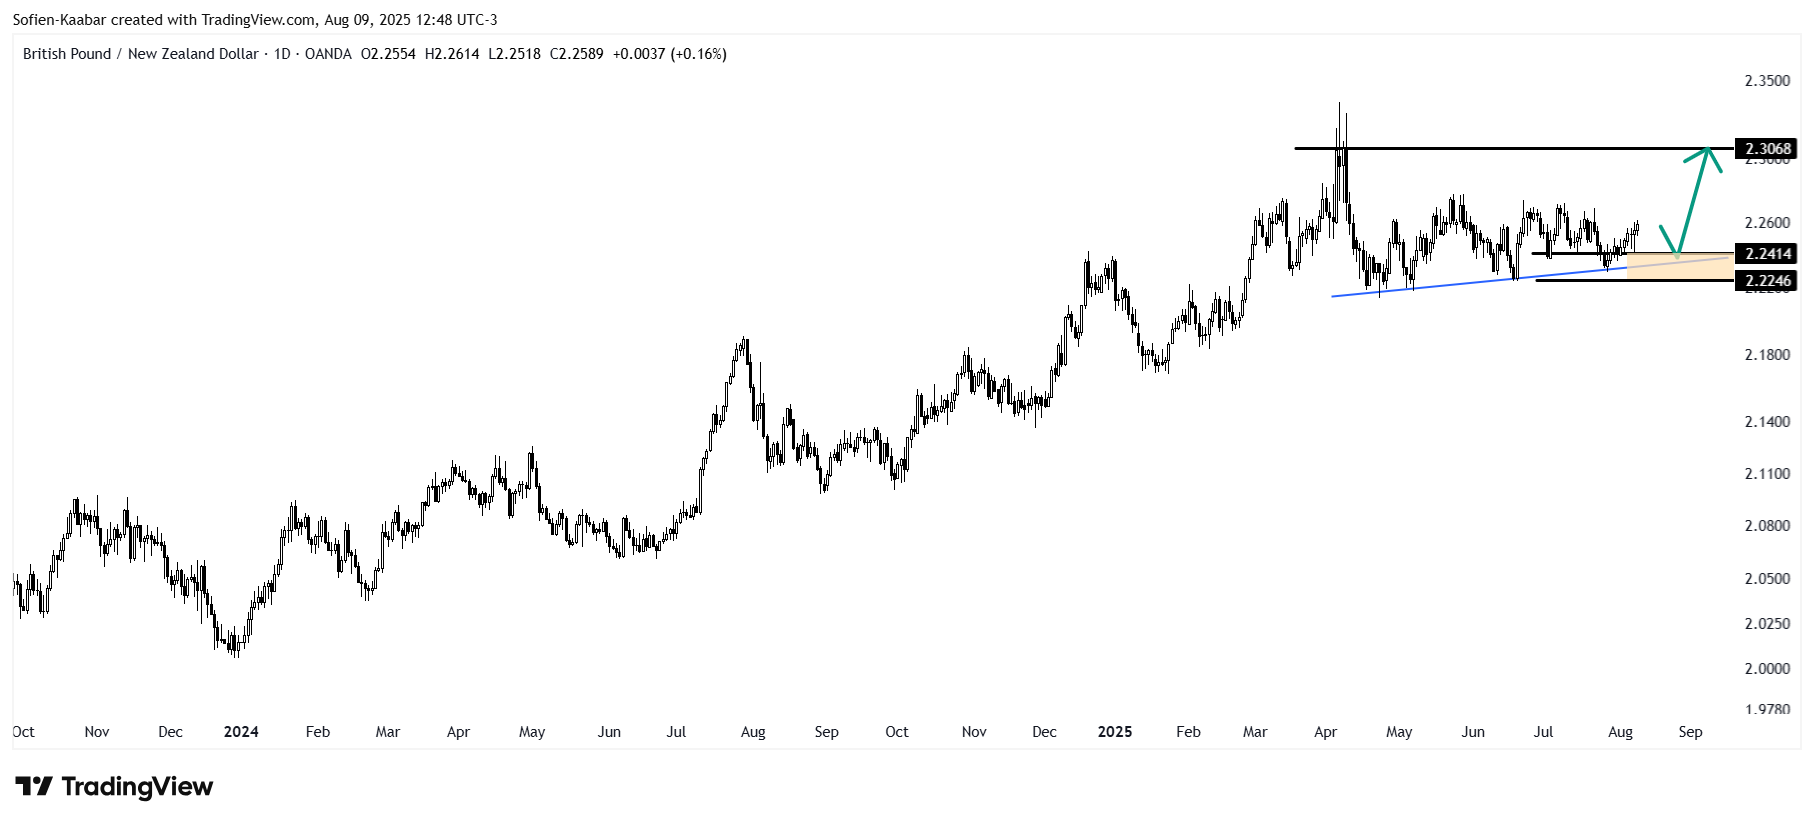
⚡ GBPNZD: Bullish reaction expected.
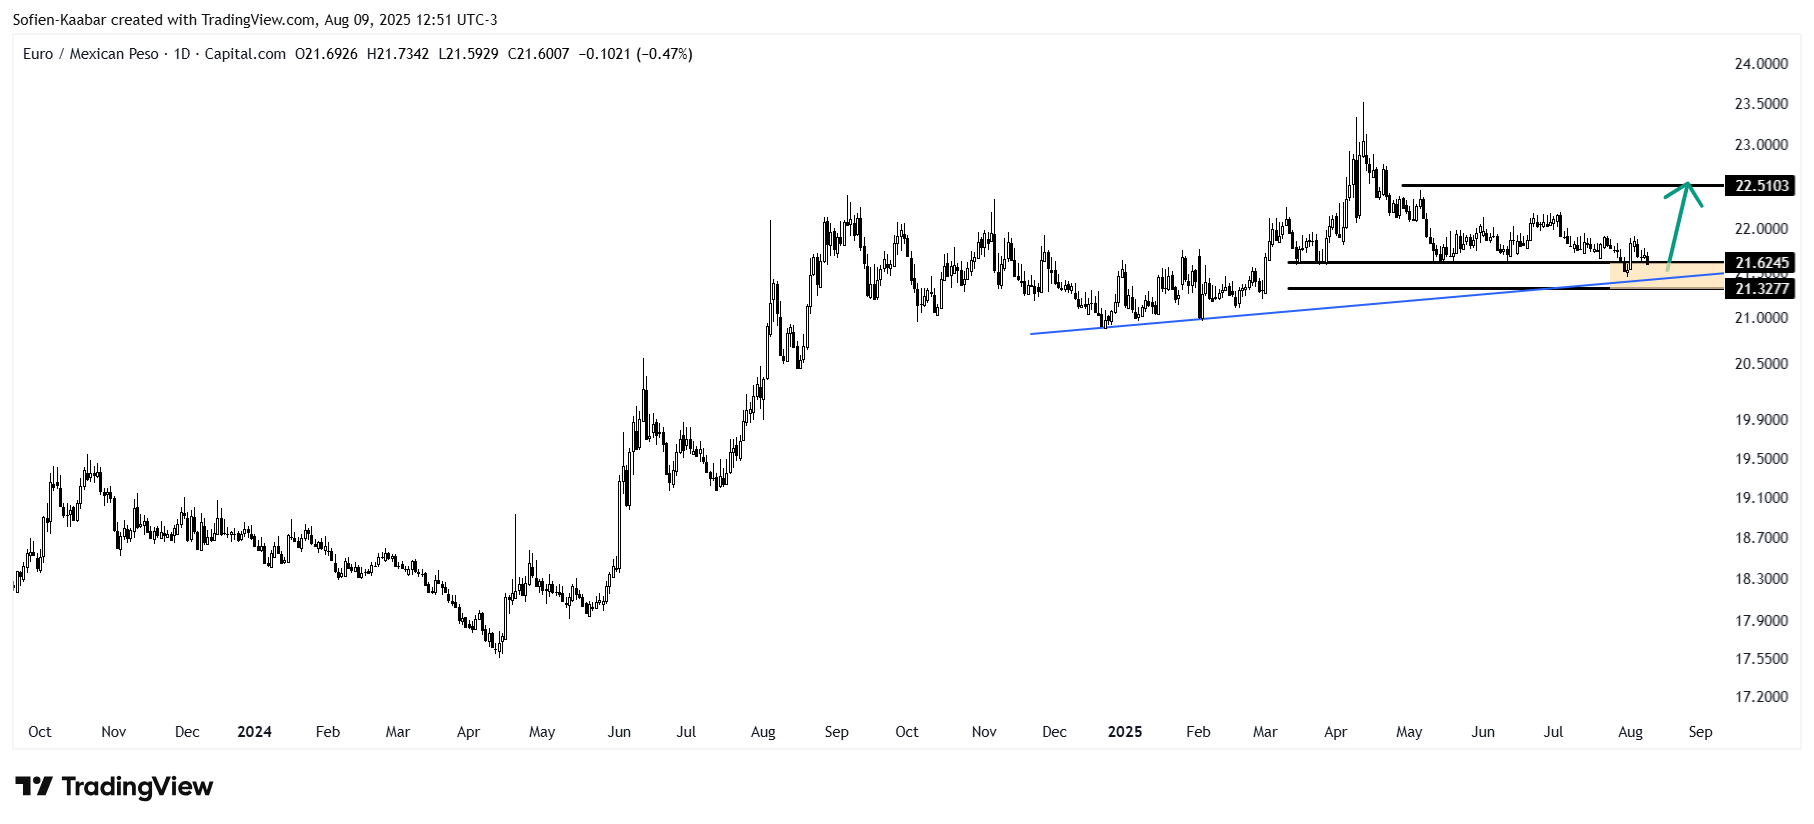
⚡ EURMXN: Bullish reaction expected.
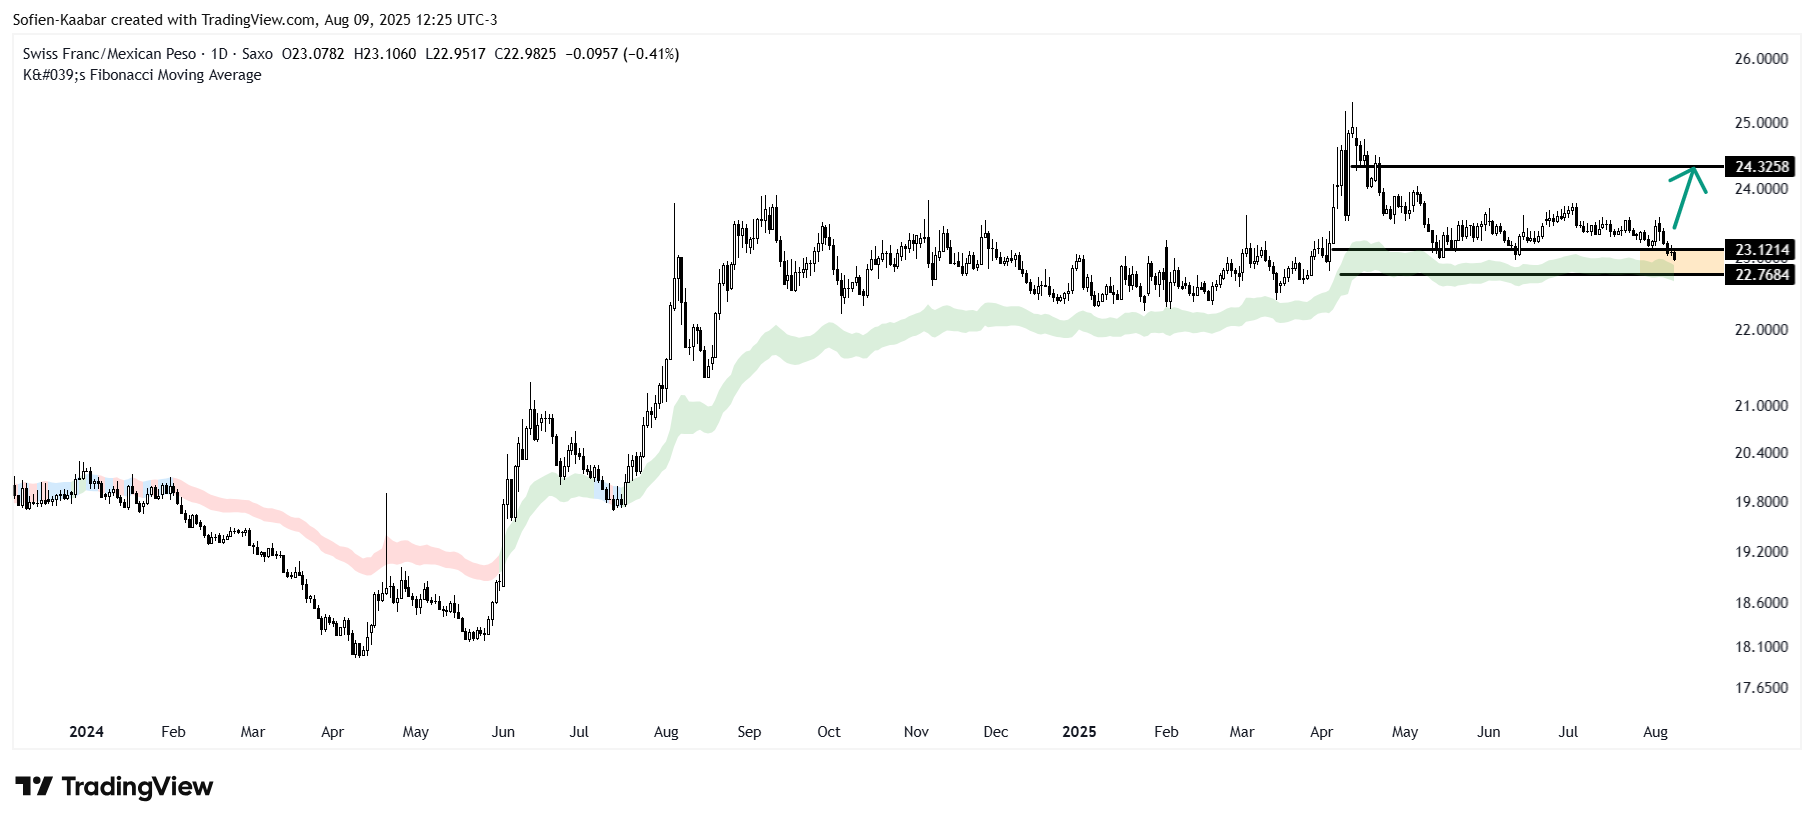
🔁 CHFMXN: Bullish reaction expected.
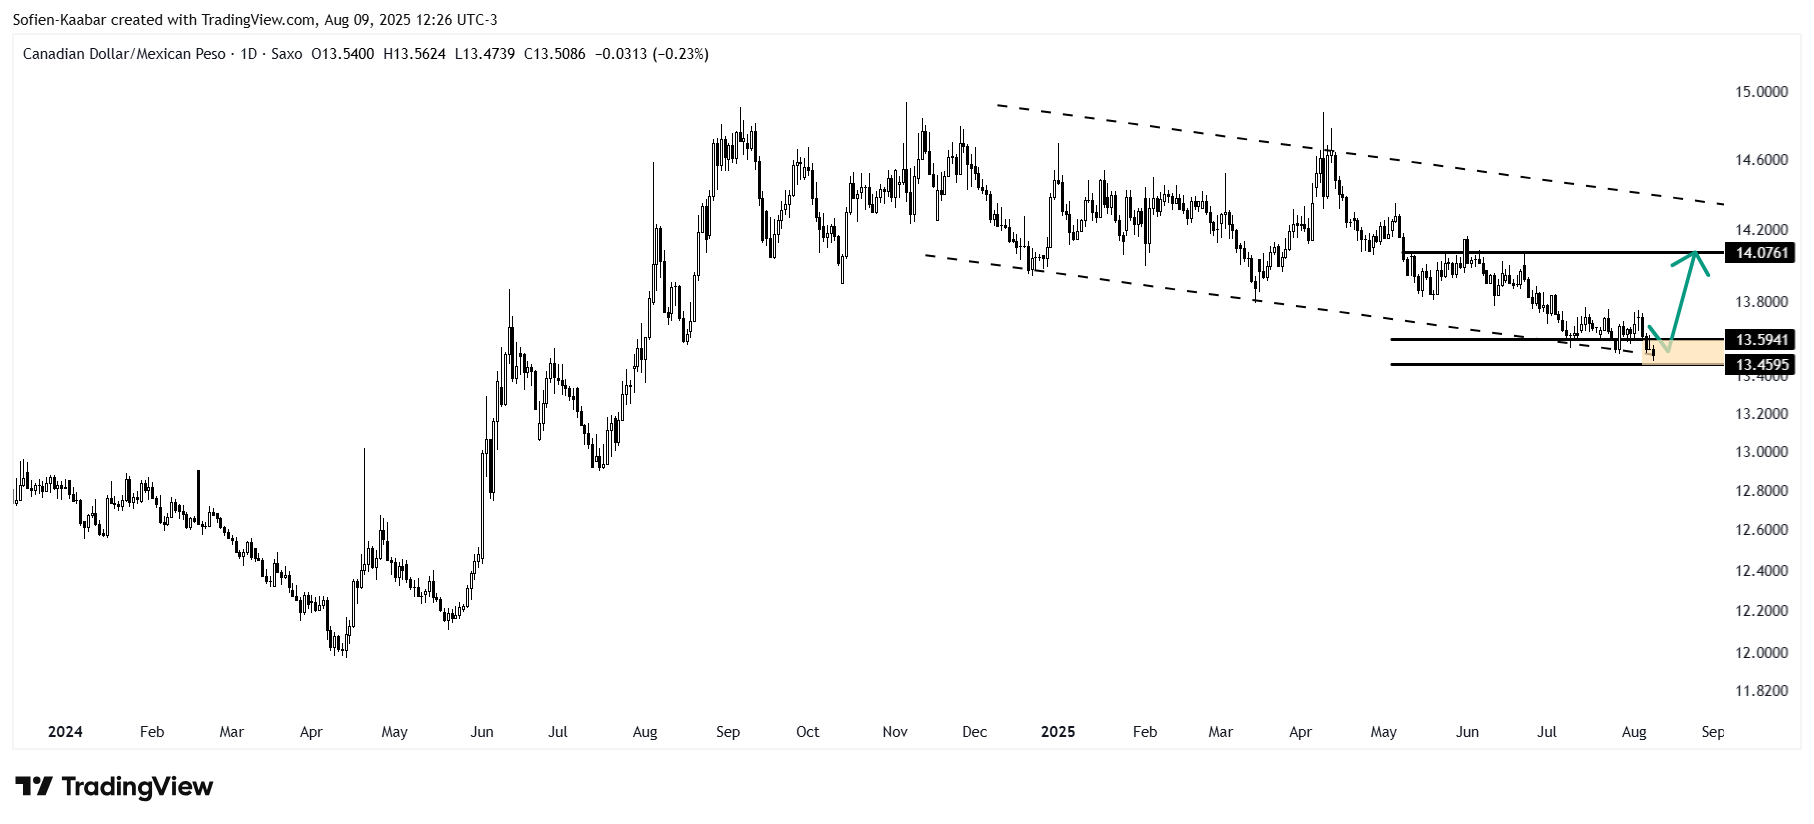
🔁 CADMXN: Bullish reaction expected.
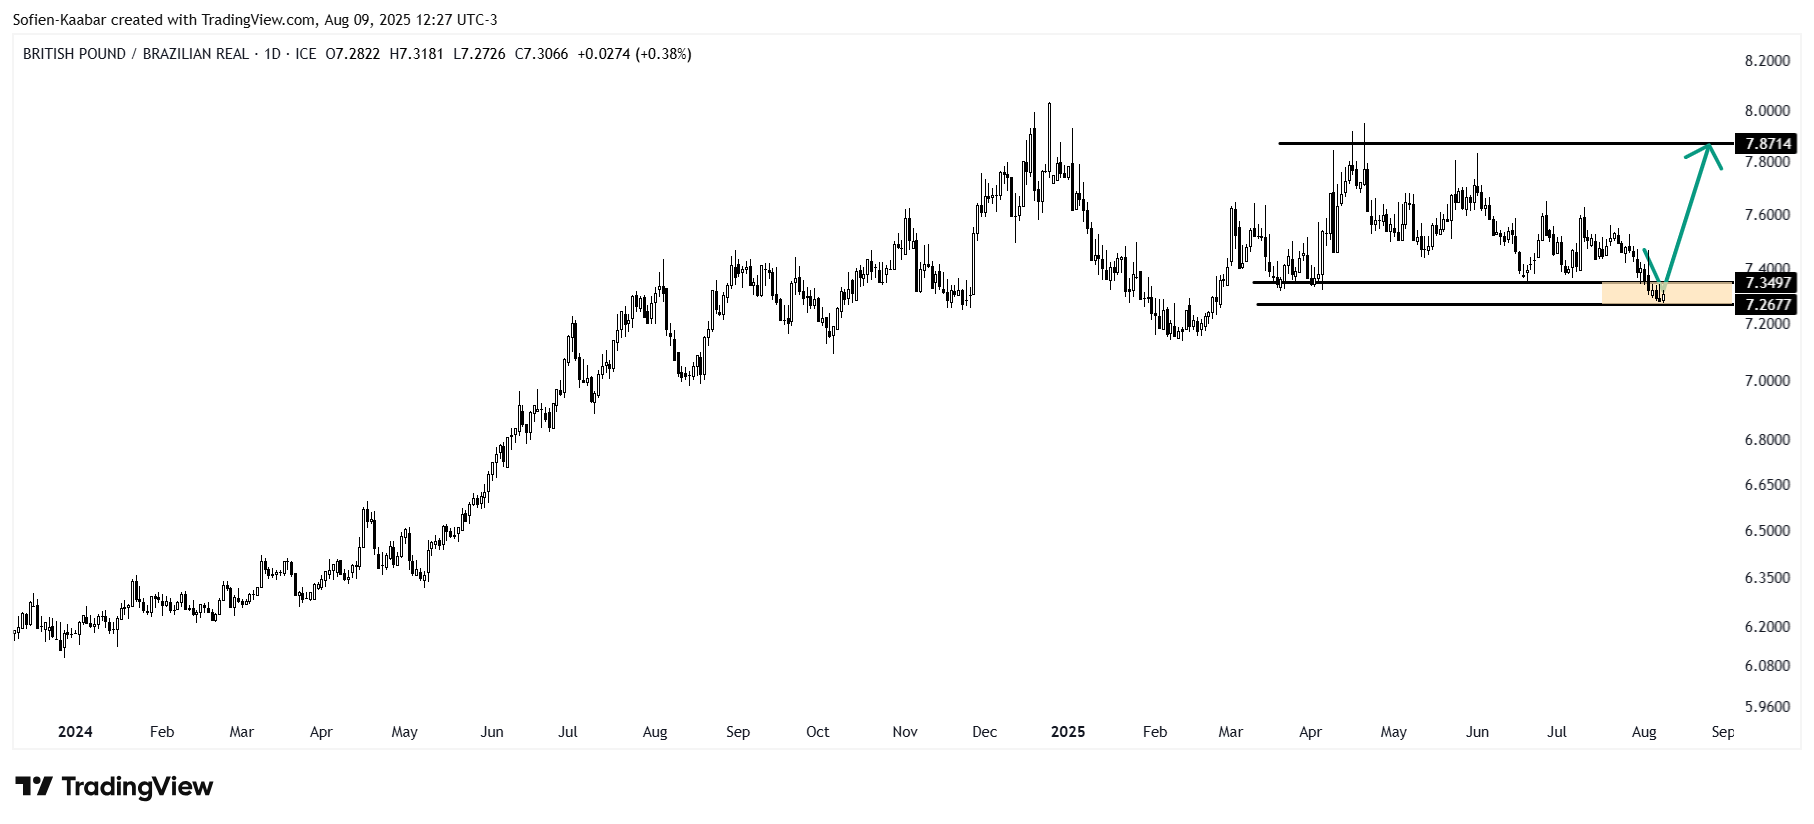
🔁 GBPBRL: Bullish reaction expected.
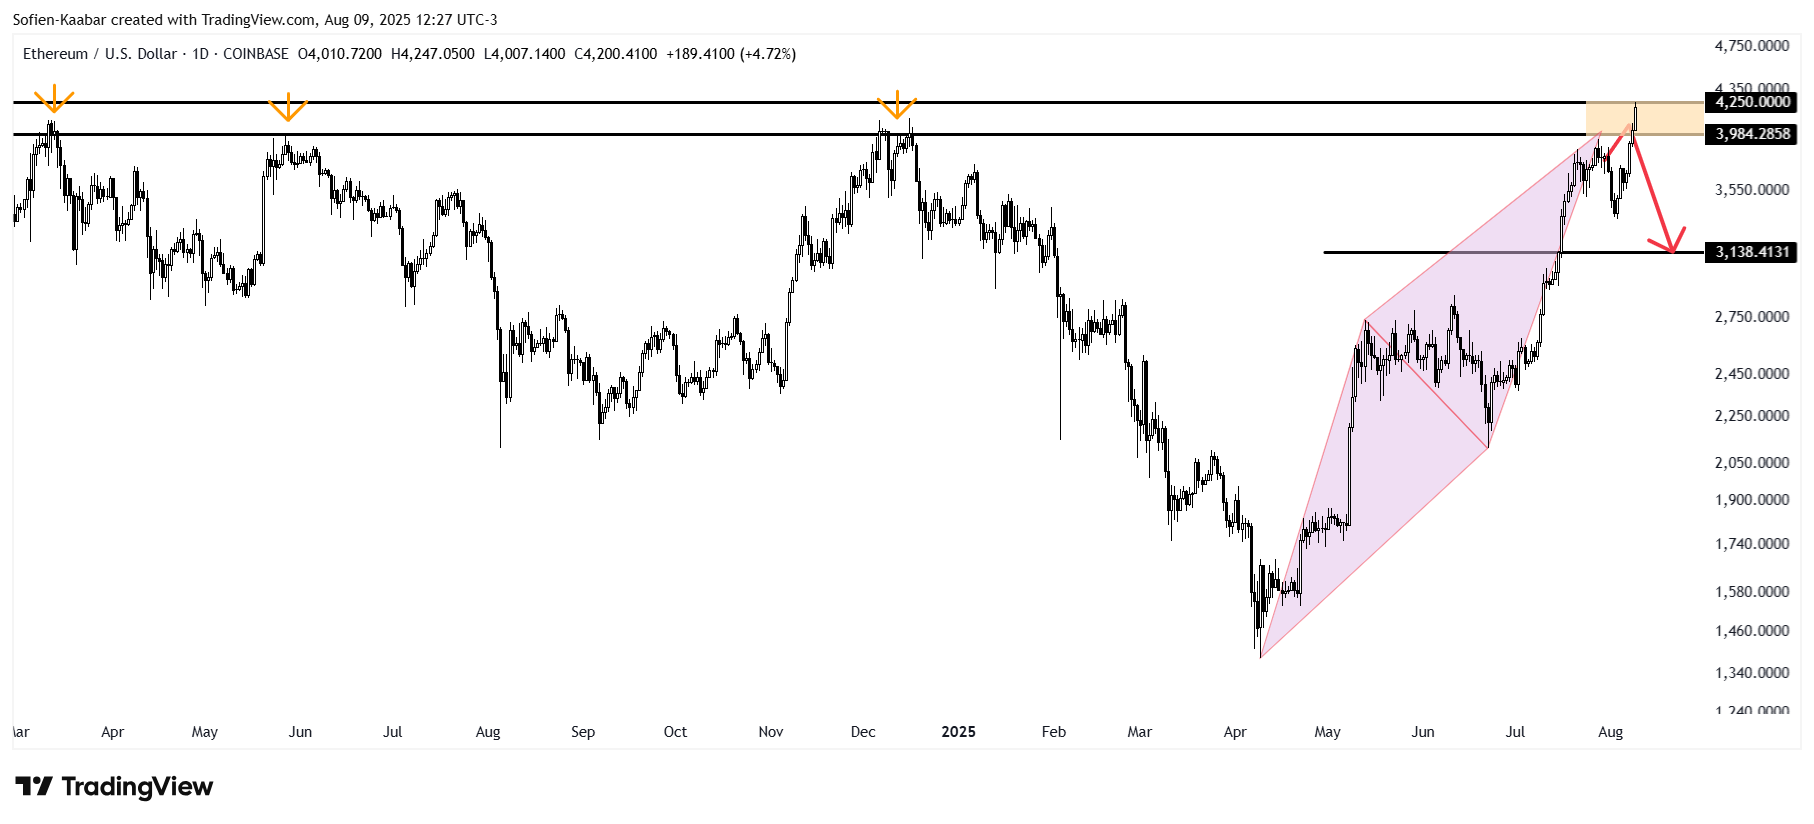
🔁 ETHUSD: Bearish reaction expected.
🔁 MXNJPY: Bearish reaction expected.
🔁 EURJPY: Bearish reaction expected.
🔁 USDMXN: Bullish reaction expected.
🔁 EURAUD: Bearish reaction expected.
🔁 SPX/NIKKEI: Bullish reaction expected.
🔁 CHFBRL: Bullish reaction expected.
❌ USDBRL: View invalidated.
❌ BTCETH: View invalidated.
❌ EURCHF: View invalidated.
⛓️💥 USDZAR: View neutralized due to market not reaching entry.
⛓️💥 AUDCAD: View neutralized due to market not reaching entry.
Keep reading with a 7-day free trial
Subscribe to The Signal Beyond to keep reading this post and get 7 days of free access to the full post archives.