🎄 The Weekly Market Sentiment Report: 24th December - 31st December 2023 🎄
The Weekly Market Analysis Report: 24/12/2023 - 31/12/2023
CONTENTS
WHAT TO EXPECT FOR 2024
EVOLUTION OF THE REPORT
CORRELATION HEATMAP
THE COT REPORT - THE LEAD STRATEGY
THE STRUCTURAL DOLLAR SENTIMENT INDEX
THE STATISTICAL SENTIMENT INDEX
DISCLAIMER
WHAT TO EXPECT FOR 2024 🎇
This week’s version will be very light as markets are expected to be calm and you’re expected to be with your friends and family. It will mostly contain a follow-up of the views instead of new ideas. The economic calendar, the track record, and a few indicators will be omitted from this version and will resume in the next one.
2024 will be a big year for this newsletter as more markets will be added, more asset classes will be covered, and charts will have better clarity and interpretation. The track record will continue to include the views from the inception of the newsletter.
Many indicators will have historical data for better interpretation. Some models will be removed due to a low frequency of signals, while other models will be added as soon as they validate their robustness tests. Fixed income products may be introduced to the newsletter if there is enough demand. Current models will also be transformed into newer versions, and will be deeper, better, and clearer.
Merry Christmas and happy holidays! 🎄🎄
EVOLUTION OF THE REPORT
This report will grow in time due to feedback and new techniques put into place. New sentiment models are constantly added while taking into account their overall utility. Feel free to leave a feedback (e.g. nature of the document, its usefulness, its time interval, its content, language, etc.).
The directional views are represented using the following convention and are followed by their charts:
⚡ This symbol represents a new directional opportunity.
🔁 This symbol represents an on-going directional opportunity.
✅ This symbol represents a recently closed opportunity at a profit.
❌ This symbol represents a recently closed opportunity at a loss.
CORRELATION HEATMAP
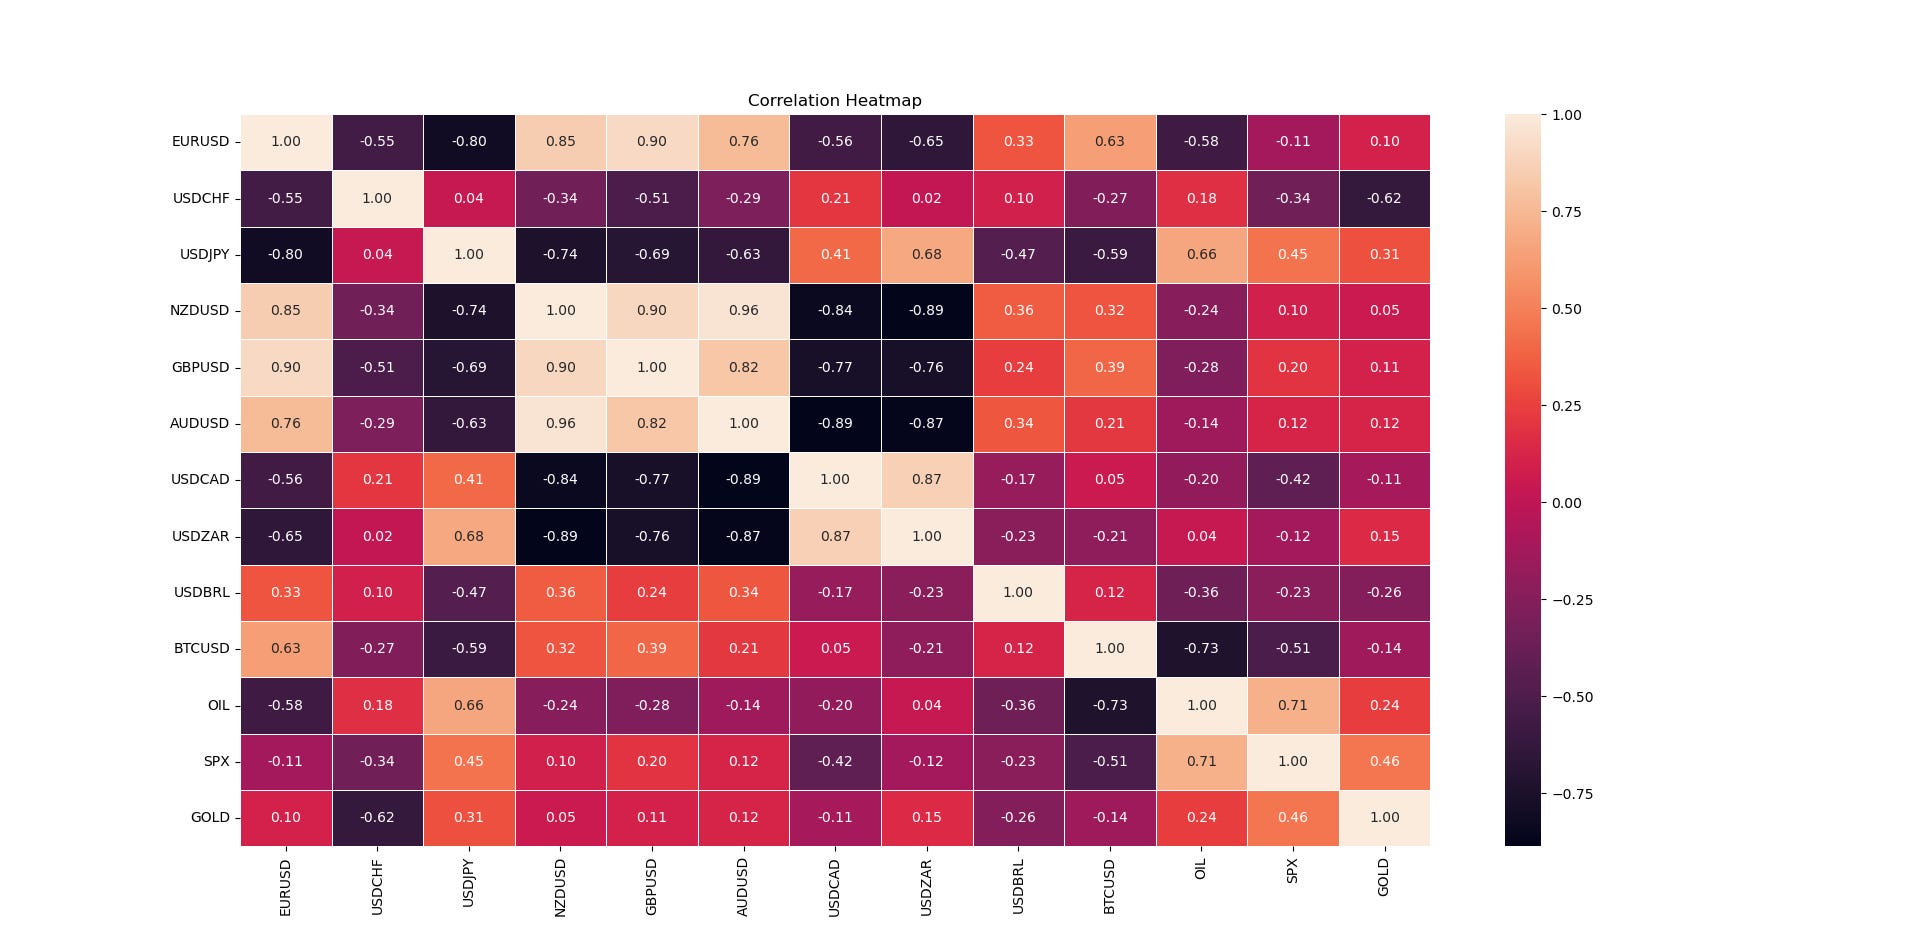
Correlation is a statistical measure that quantifies the relationship between variables. It measures how closely the returns of two or more assets move together. It ranges from -1 to 1. Understanding the correlations between different markets and asset classes is crucial for managing risk and expectations. The following shows the heatmap between different key markets.
THE COT REPORT - THE LEAD STRATEGY
The CFTC publishes statistics of the futures market on a weekly basis called the Commitment of traders (COT) report. The report has many valuable information inside, namely the number of futures contracts held by market participants (hedge funds, banks, producers of commodities, speculators, etc.). Two main categories must be distinguished:
Commercial players: They deal in the futures markets for hedging purposes (i.e. to cover their operations or other trading positions). Examples of hedgers include investment banks and agricultural giants. Their positions are negatively correlated with the underlying market.
Non-commercial players: They deal in the futures markets for speculative reasons (i.e. to profit from their positions). Examples of speculators include hedge funds. Their positions are positively correlated with the underlying market.
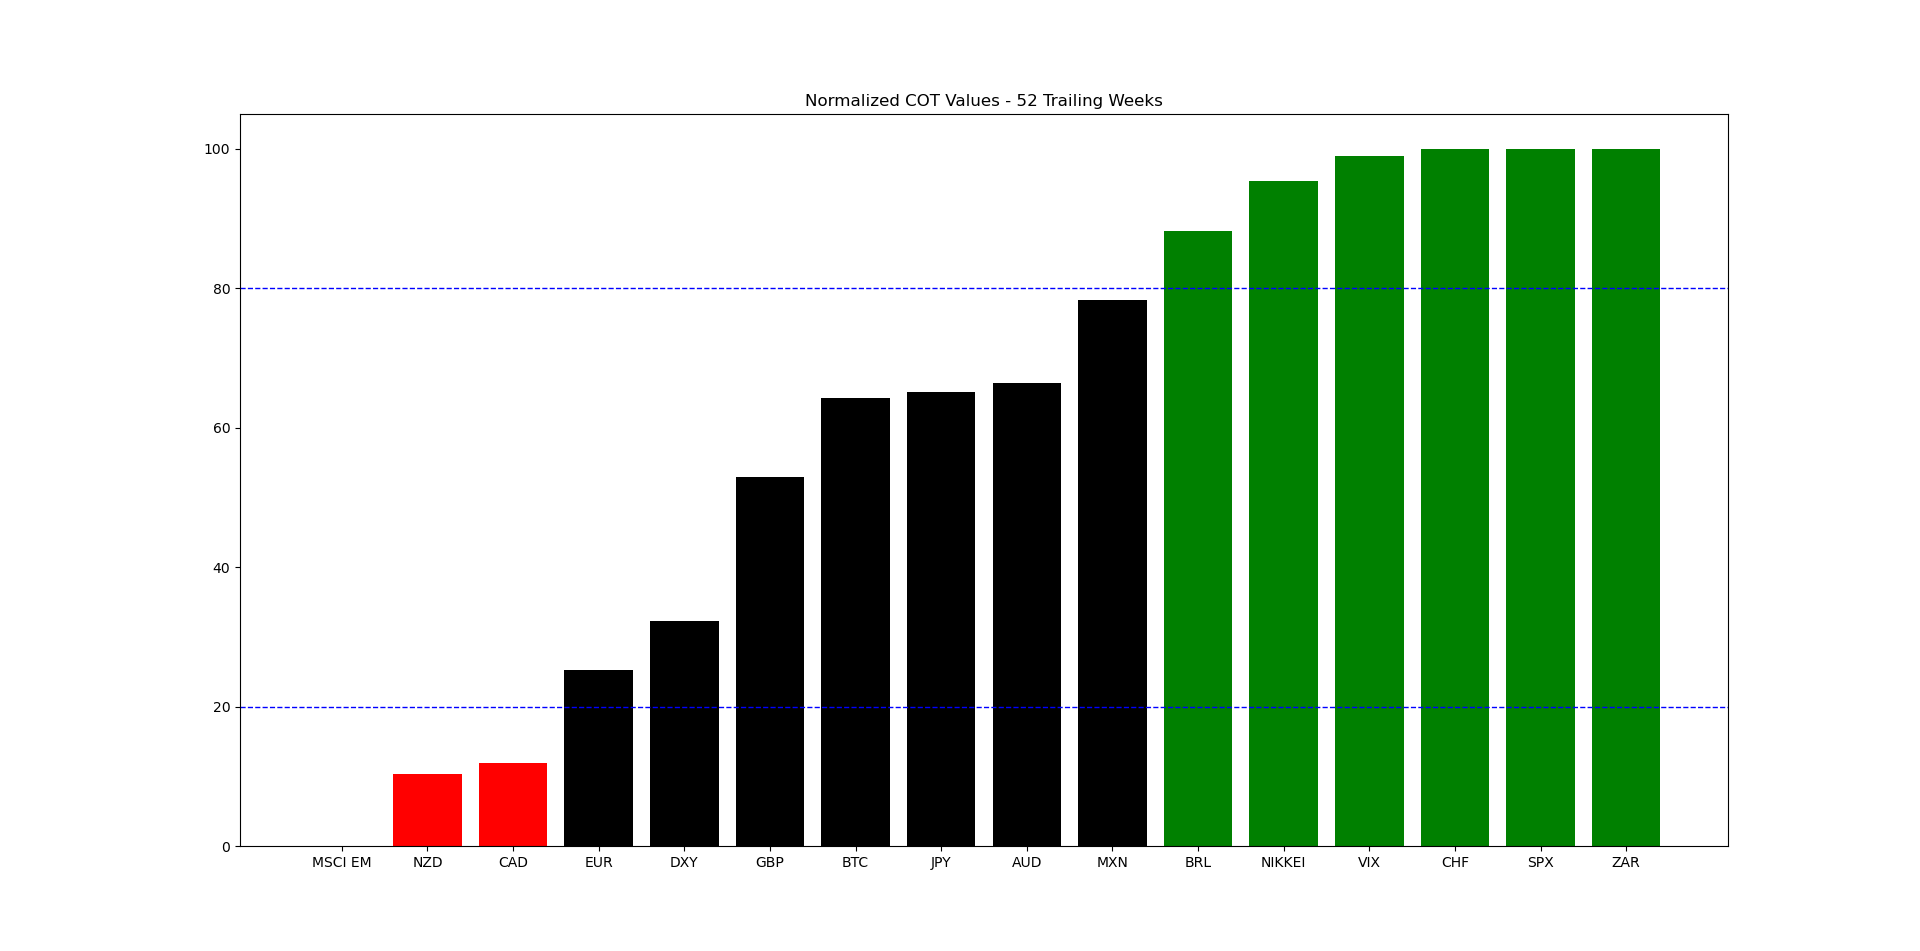
The lead strategy is the core of this report. It highlights the markets that are overbought or oversold with regards to sentiment. The key views are found by combining different markets together. For example, if the EUR has an extremely bearish sentiment and the CAD has an overly bullish sentiment, then a bullish position on EURCAD can be interesting if the technicals justify it.
The following table summarizes the current state of the sentiment for FX and IX markets:
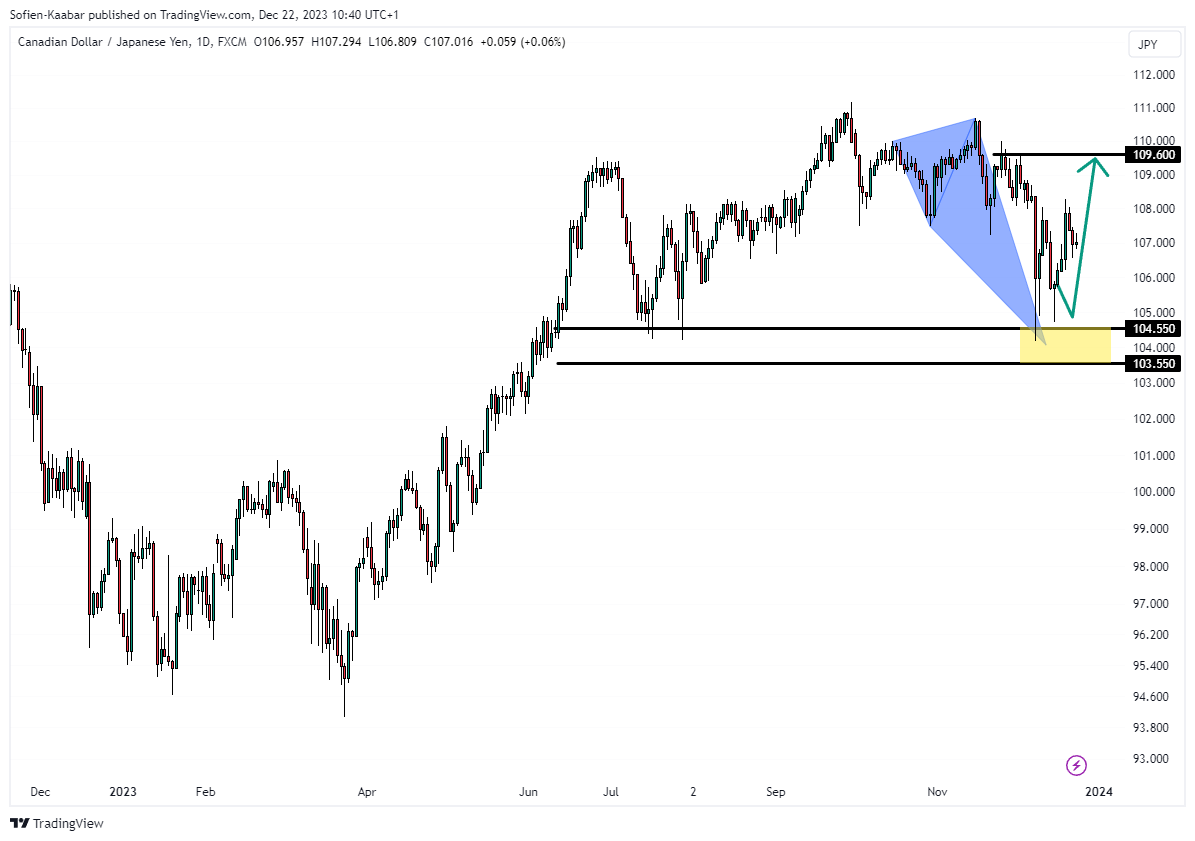
Make sure to remember that theses are not advices whatsoever, they are merely charts that fuse sentiment analysis with technical analysis:
⚡EURZAR: Bullish move expected around 20.08/19.87 to 20.90.
🔁 CADJPY: Bullish move expected around 104.55/103.55 to 109.60.
🔁 NIKKEI/EEM: Bearish move expected around 850/866 to 770. Therefore, Japan to underperform emerging market stocks.
The following table summarizes the current state of the sentiment for commodity markets:
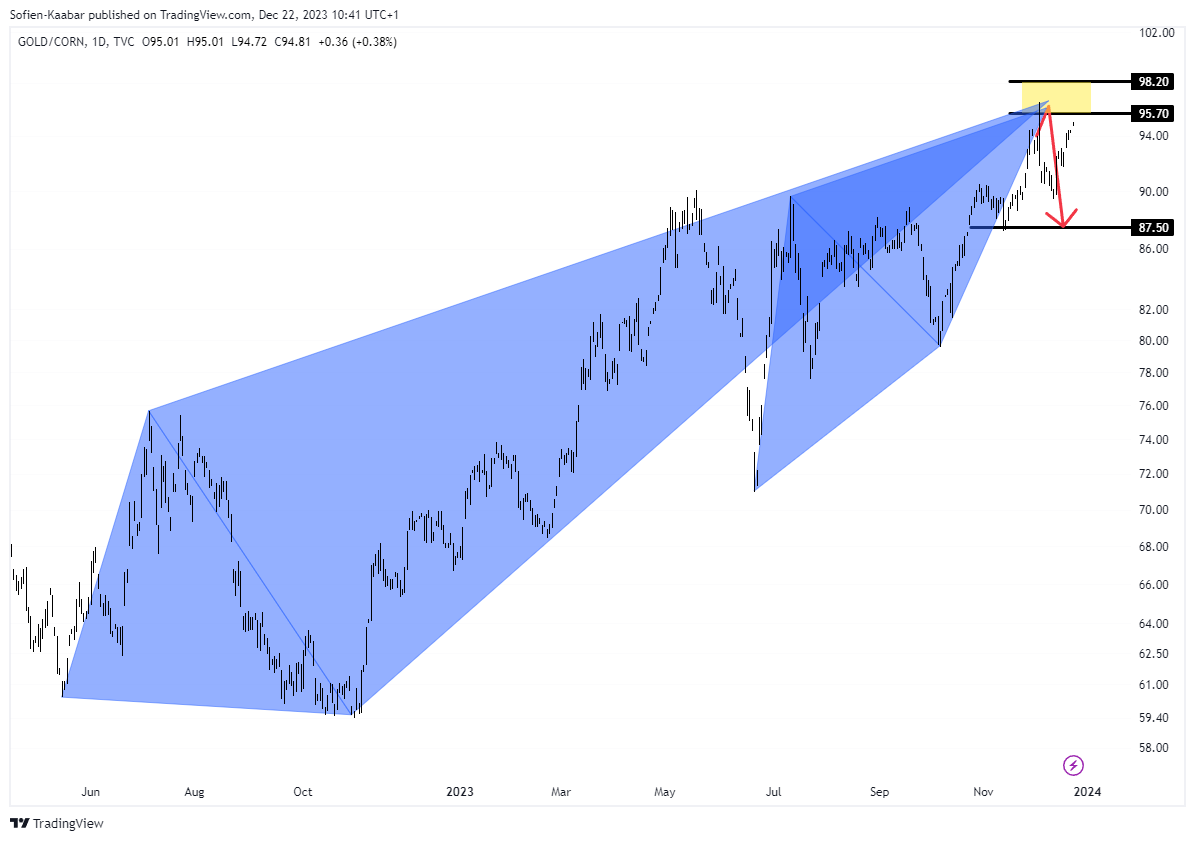
Make sure to remember that theses are not advices whatsoever, they are merely charts that fuse sentiment analysis with technical analysis:
🔁 GOLD/CORN: Bearish move expected around 95.70/98.20 to 87.00.
⚠️ The track record of the lead strategy can be found at the end of the report ⚠️
You can also check out my other newsletter The Weekly Market Analysis Report that sends tactical directional views every weekend to highlight the important trading opportunities using technical analysis that stem from modern indicators. The newsletter is Free.
THE STRUCTURAL DOLLAR SENTIMENT INDEX
This index simply calculates the percentage of the USD major crosses that are above their 21-Day, 34-Day, and 89-Day moving average. It represents a sentiment shift if some USD crosses start breaking or surpassing their respective moving averages. The following are the latest values:
The interpretation of the index is discretionary, but generally high values (close to 90%-100%) are correlated with corrective phases while low values (close to 10%-0%) are correlated with recovery phases.
This indicator will include historical values soon to compare with the DXY index. This allows for better interpretation.
STATISTICAL SENTIMENT INDEX
The statistical sentiment index (SSI) is a new calculation I have developed to aid in forecasting tactical market directions. The SSI is composed of a selected indicators and calculations in order to find overheating moments. The following table sums up the current sentiment view on a selection of markets.
The SSI can have six different states:
Bullish signal triggered: This signal is generated whenever the conditions of the SSI are met for an expected bullish price action after a sentiment shift.
Bullish signal imminent: This state is generated when a bullish signal is expected soon.
Neutral territory: This state occurs when the SSI is in neutral territory and is not showing any directional elements.
Bearish signal imminent: This state is generated when a bearish signal is expected soon.
Bearish signal triggered: This signal is generated whenever the conditions of the SSI are met for an expected bearish price action after a sentiment shift.
The following is the current stance of the SSI:
🔁 S&P 500: A bearish signal is in progress.
The following charts are illustrations of the previous signals above:
DISCLAIMER
Every information contained in the report is solely for the purpose of showing another angle. Since it is NOT investment advice or trade recommendations, you must NOT use the report as the sole reason for your trading and investing activities.
Trading is fun, enriching, and interesting but not when it comes at the expense of your hard-earned funds. Do not risk what you cannot afford to lose. You must only trade with money you have already considered gone and you must not use trading as your sole revenue generator. Risk management is even more important than the trading strategy itself, make sure to master it.
Data can have many representations and the information presented is but one side of the story which may be incomplete. All back-testing and forward testing results reflect their own time period and not the future as is the case in every research piece.


