The Weekly Market Sentiment Report: 12th November - 19th November 2023
The Weekly Market Sentiment Report: 12/11/2023 - 19/11/2023
CONTENTS
EVOLUTION OF THE REPORT
ECONOMIC CALENDAR
CORRELATION HEATMAP 🔥 NEW 🔥
THE COT REPORT - THE LEAD STRATEGY
THE COT REPORT - PATTERN RECOGNITION
THE STRUCTURAL EQUITY SENTIMENT INDEX
THE STRUCTURAL DOLLAR SENTIMENT INDEX 🔥 NEW 🔥
THE EQUITY PUT-CALL RATIO SENTIMENT
THE STATISTICAL SENTIMENT INDEX 🔥 NEW 🔥
THE AAII EQUITY SENTIMENT INDEX
GERMANY ZEW ECONOMIC SENTIMENT INDEX
THE ISM PURCHASING MANAGER’S INDEX
THE UNIVERSITY OF MICHIGAN CONSUMER SENTIMENT INDEX
THE LEAD STRATEGY TRACK RECORD
DISCLAIMER
EVOLUTION OF THE REPORT
This report will grow in time due to feedback and new techniques put into place. New sentiment models are constantly added while taking into account their overall utility. Feel free to leave a feedback (e.g. nature of the document, its usefulness, its time interval, its content, language, etc.).
The directional views are represented using the following convention and are followed by their charts:
⚡ This symbol represents a new directional opportunity.
🔁 This symbol represents an on-going directional opportunity.
✅ This symbol represents a recently closed opportunity at a profit.
❌ This symbol represents a recently closed opportunity at a loss.
ECONOMIC CALENDAR
An economic calendar is a tool used in finance and economics to track and display upcoming economic events, announcements, and indicators that are relevant to the financial markets and the broader economy. The following shows what to expect for the coming week.
CORRELATION HEATMAP
Correlation is a statistical measure that quantifies the relationship between variables. It measures how closely the returns of two or more assets move together. It ranges from -1 to 1. Understanding the correlations between different markets and asset classes is crucial for managing risk and expectations. The following shows the heatmap between different key markets.
THE COT REPORT - THE LEAD STRATEGY
The CFTC publishes statistics of the futures market on a weekly basis called the Commitment of traders (COT) report. The report has many valuable information inside, namely the number of futures contracts held by market participants (hedge funds, banks, producers of commodities, speculators, etc.). Two main categories must be distinguished:
Commercial players: They deal in the futures markets for hedging purposes (i.e. to cover their operations or other trading positions). Examples of hedgers include investment banks and agricultural giants. Their positions are negatively correlated with the underlying market.
Non-commercial players: They deal in the futures markets for speculative reasons (i.e. to profit from their positions). Examples of speculators include hedge funds. Their positions are positively correlated with the underlying market.
The lead strategy is the core of this report. It highlights the markets that are overbought or oversold with regards to sentiment. The key views are found by combining different markets together. For example, if the EUR has an extremely bearish sentiment and the CAD has an overly bullish sentiment, then a bullish position on EURCAD can be interesting if the technicals justify it.
The following table summarizes the current state of the sentiment for FX and IX markets:
Make sure to remember that theses are not advices whatsoever, they are merely charts that fuse sentiment analysis with technical analysis:
⚡ USDMXN: Bearish move expected around 18.02/18.30 to 17.00.
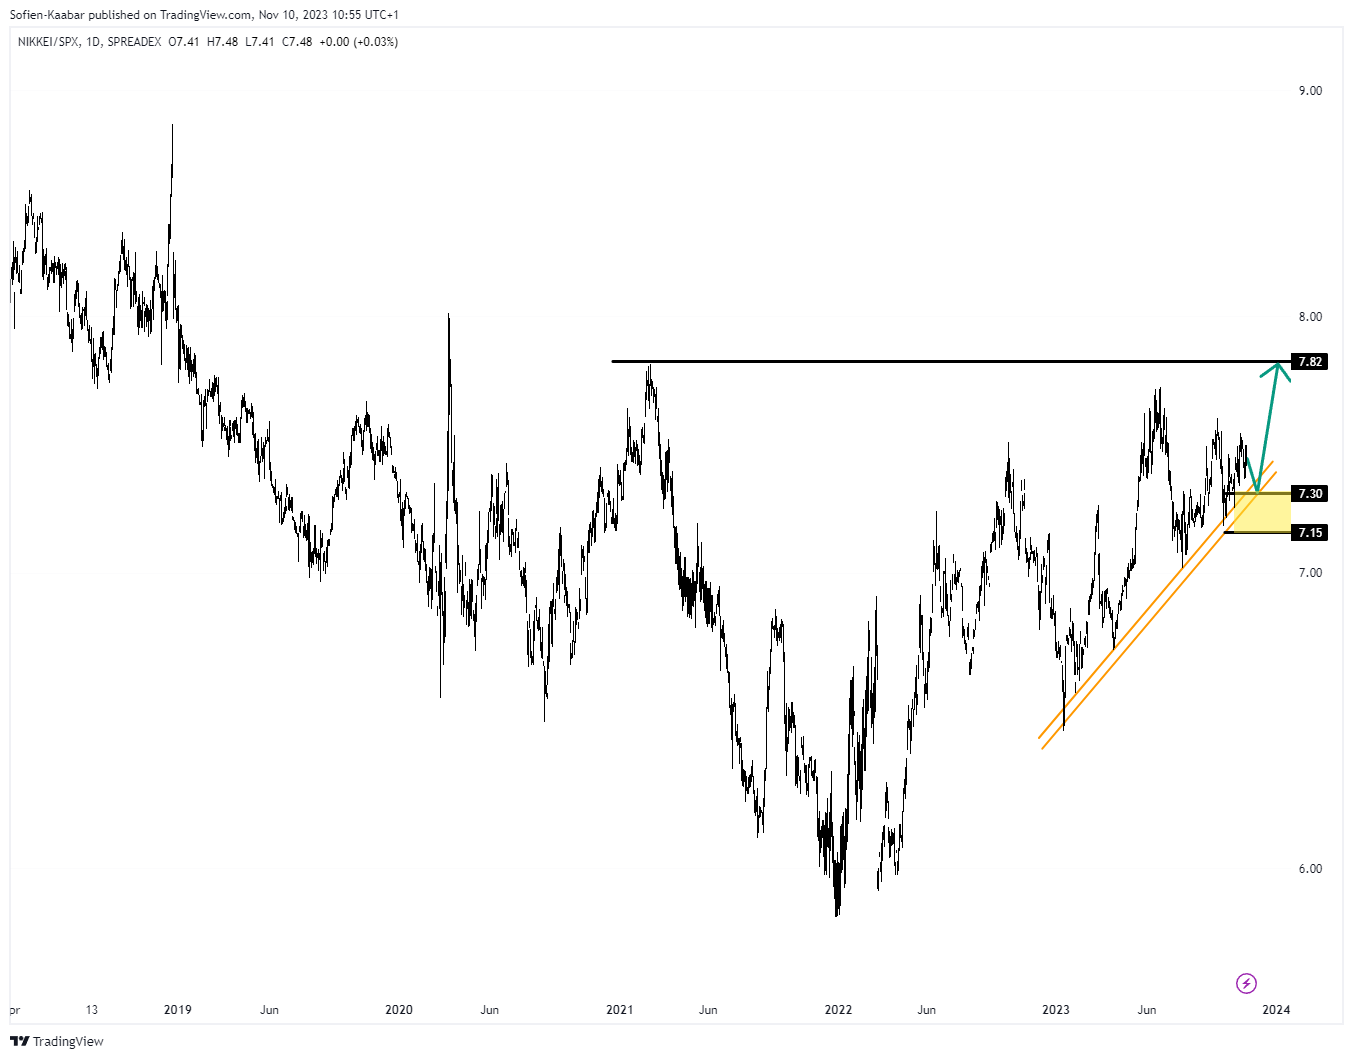
🔁 NIKKEI/SPX: Bullish move above 7.30/7.15 to 7.82.
✅ EURUSD: Potential seen.
❌AUDUSD: View invalidated.
The following table summarizes the current state of the sentiment for commodity markets:
Make sure to remember that theses are not advices whatsoever, they are merely charts that fuse sentiment analysis with technical analysis:
🔁 OIL/SUGAR: Bullish move expected above 2.60/2.47 to 2.88.
Keep reading with a 7-day free trial
Subscribe to The Signal Beyond to keep reading this post and get 7 days of free access to the full post archives.


