Weekly Market Sentiment Report: 29th January - 5th February 2023
The Weekly Market Sentiment Report: 29/01/2023 - 05/02/2023
This report covers the weekly market sentiment and positioning and any changes that have occurred which might present interesting configurations on different asset classes with a specific focus on currencies. The below shows the table of contents of the report:
The Artemis Indicator: A Tactical Reversal Tool on the S&P 500
The White Index: The Bullish Continuation Indicator
Vision: The Long Short Polyvalent Indicator
Bitcoin Tactical Sentiment Index: A Short-Term Reversal Indicator on Bitcoin
The AAII: A New Comer to the Sentiment Indicators’ Party
The COT Meter: Simplifying the Commitment of Traders
COT Pattern Recognition: Playing on Correlations
Important Legal Disclaimer
Main points:
The Artemis indicator, the star of the the forecasts lately, is not showing any signals at the moment.
Vision and the White Index are showing bullish equities signals.
No strong signals are shown from the enhanced AAII sentiment indicator.
The COT meter is showing extreme values on some currencies which may mean some corrections are due.
Added a new COT indicator based on pattern recognition for longer term trades.
The Artemis Indicator
The Artemis Indicator is born out of a transformation of the put-call ratio, a sentiment indicator published by the CBOE which helps with predicting the S&P 500. It is a daily indicator.
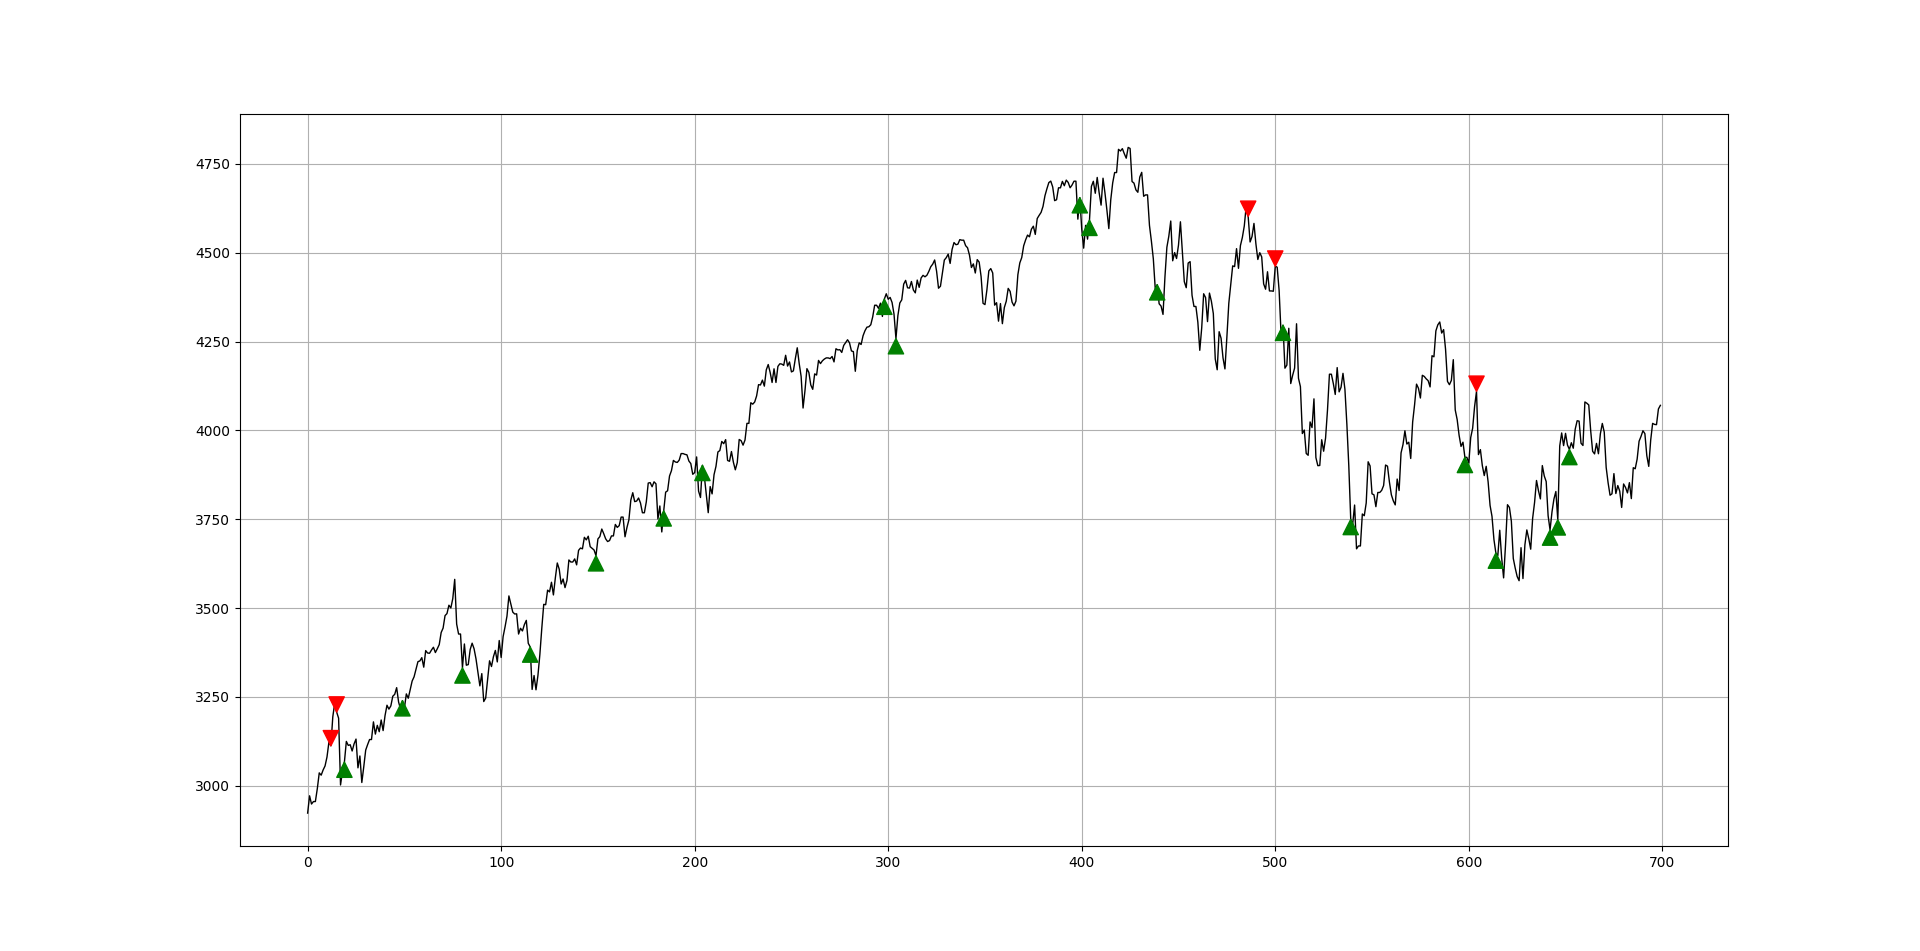
The following Figure shows the recent signal chart.
The validity of signals is variable and depends on the appearance of a new signal.
Conclusion
At the moment, there is no new signal. This indicator is currently the protagonist of the report.
The White Index
Long-only traders who like to time the dips and follow the upside trend (during a bullish market) should monitor the White Index as it has been specifically designed for this purpose.
The following Figure shows the recent signal chart.
The validity of signals is 20 days and also depends on the appearance of a new signal.
Conclusion
A bullish signal has appeared which argues for a higher value in 20 days.
Keep reading with a 7-day free trial
Subscribe to The Weekly Market Sentiment Report to keep reading this post and get 7 days of free access to the full post archives.


