Weekly Market Sentiment Report: 5th February - 12th February 2023
The Weekly Market Sentiment Report: 05/02/2023 - 12/02/2023
This report covers the weekly market sentiment and positioning and any changes that have occurred which might present interesting configurations on different asset classes with a specific focus on currencies. The below shows the table of contents of the report:
The Artemis Indicator: A Tactical Reversal Tool on the S&P 500
The White Index: The Bullish Continuation Indicator on the S&P 500
Vision: The Long Short Polyvalent Indicator on the S&P 500
Bitcoin Tactical Sentiment Index: A Short-Term Reversal Indicator on Bitcoin
The AAII: A New Comer to the Sentiment Indicators’ Party
The COT Meter: Simplifying the Commitment of Traders on FX
COT Pattern Recognition: Playing on Correlations on FX
Important Legal Disclaimer
Main points:
The Artemis indicator, the star of the the forecasts lately, is not showing any signals at the moment.
Vision and the White Index remain bullish since signalling more equity markets strength since 22nd, January 2023.
No strong signals are shown from the enhanced AAII sentiment indicator other than a slight bullish bias.
The two COT measures will be updated as soon as the new data comes to the CFTC website as they have a small expected delay. The report will therefore update as soon as the official government data is released.
The Artemis Indicator
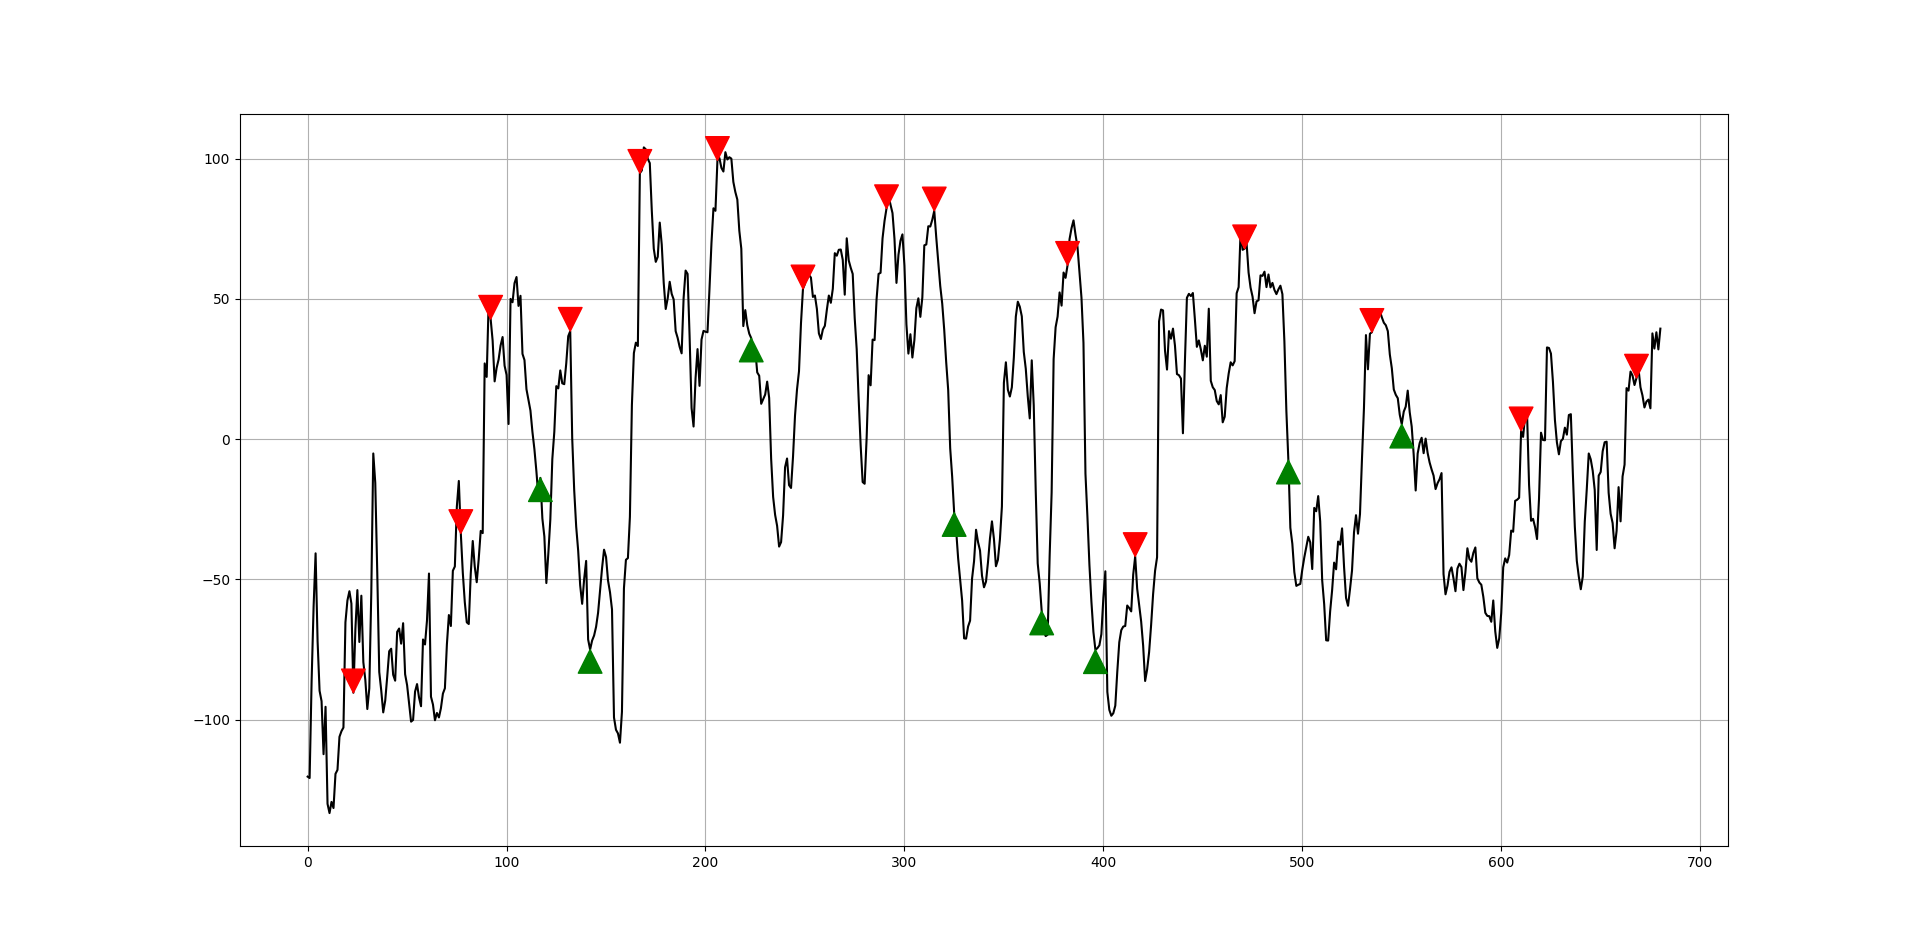
The Artemis Indicator is born out of a transformation of the put-call ratio, a sentiment indicator published by the CBOE which helps with predicting the S&P 500. It is a daily indicator.
The following Figure shows the recent signal chart.
Conclusion
At the moment, there is no new signal. This indicator is currently the protagonist of the report due to its success in predicting tops and bottoms.
The White Index
Long-only traders who like to time the dips and follow the upside trend (during a bullish market) should monitor the White Index as it has been specifically designed for this purpose.
The following Figure shows the recent signal chart.
Conclusion
The indicator remains bullish since printing the signal.
Historical Track Record
Vision
Vision uses insights from dealer markets to find statistical extremes on the S&P 500. Rich with information, the indicator seems to outperform its peers in predictability.
The following Figure shows the recent signal chart.
Conclusion
The indicator remains bullish since printing the signal.
Historical Track Record
Bitcoin Tactical Sentiment Index
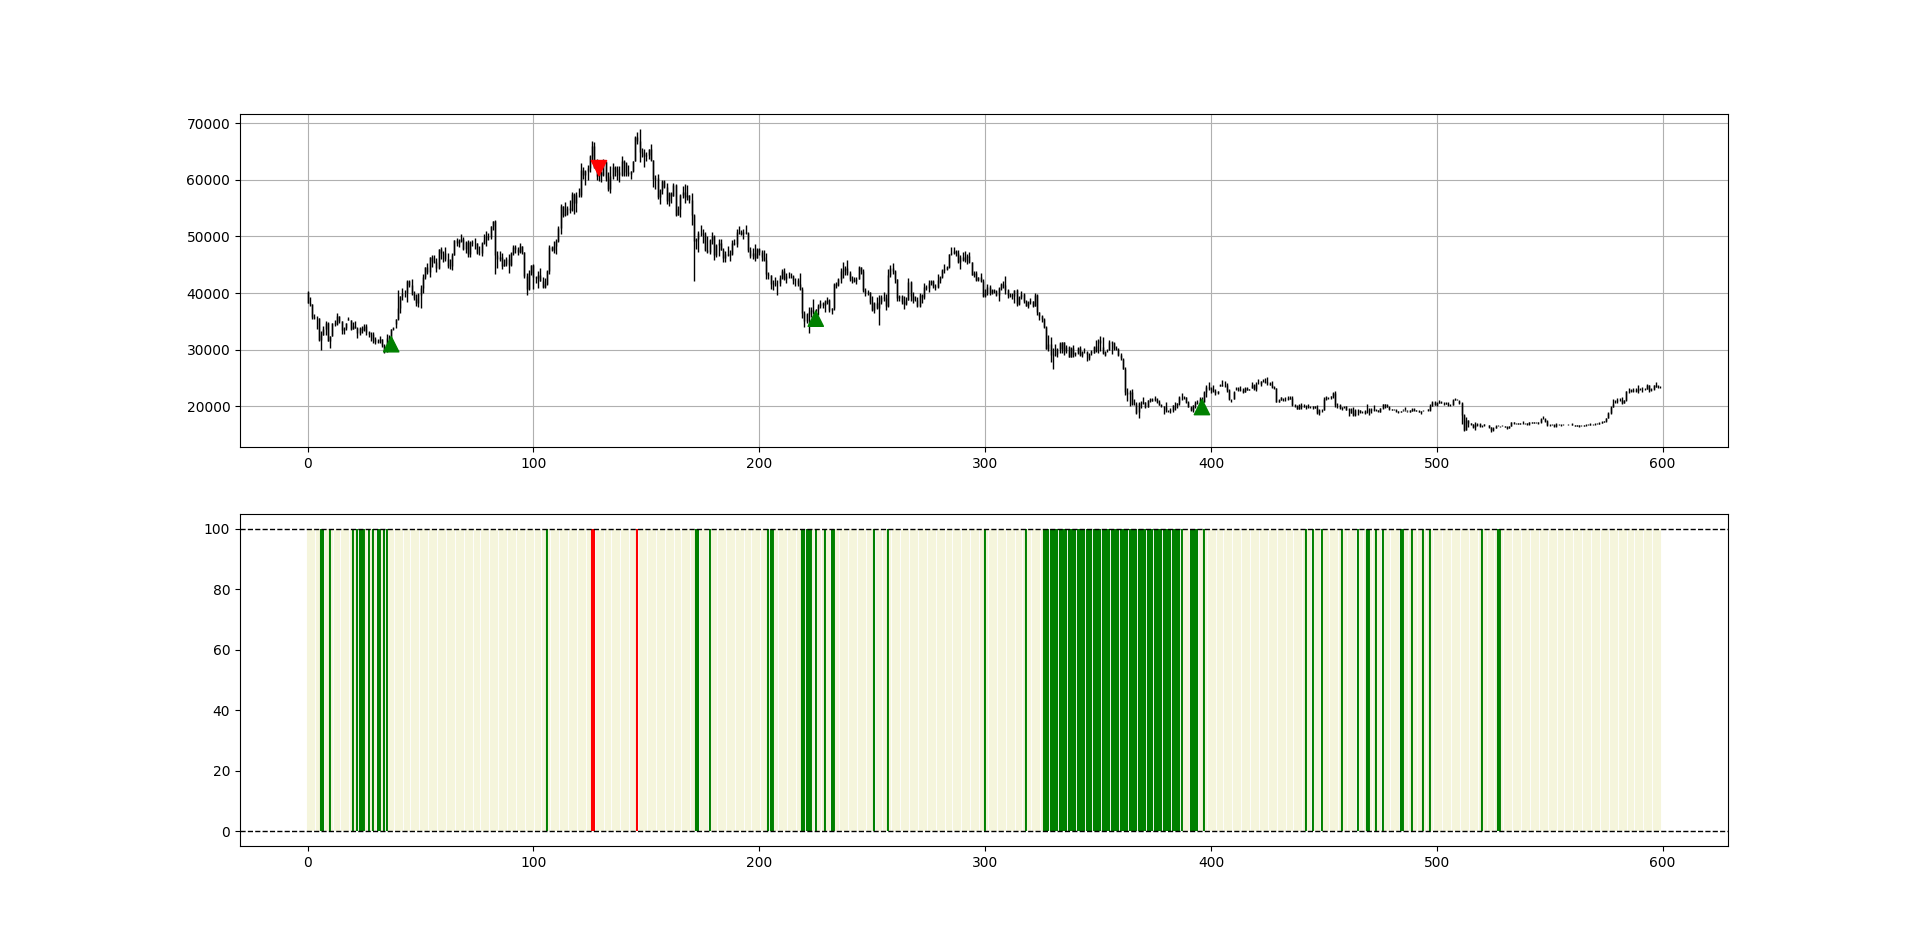
The Bitcoin Tactical Sentiment Index is a daily sentiment-based indicator which uses insights from volatility, direct surveys, open interest, and patterns to calculate a normalized value that shows where the inflection points are likely to be.
The following Figure shows the recent signal chart.
Conclusion
The model is continuously scanning for a new opportunity. In case a signal is found, an update will be sent to the subscriber. The rare signals on this model may seem frustrating but it is important to know how powerful they are given the back-tests and the live performance.
Historical Track Record
The AAII Indicator
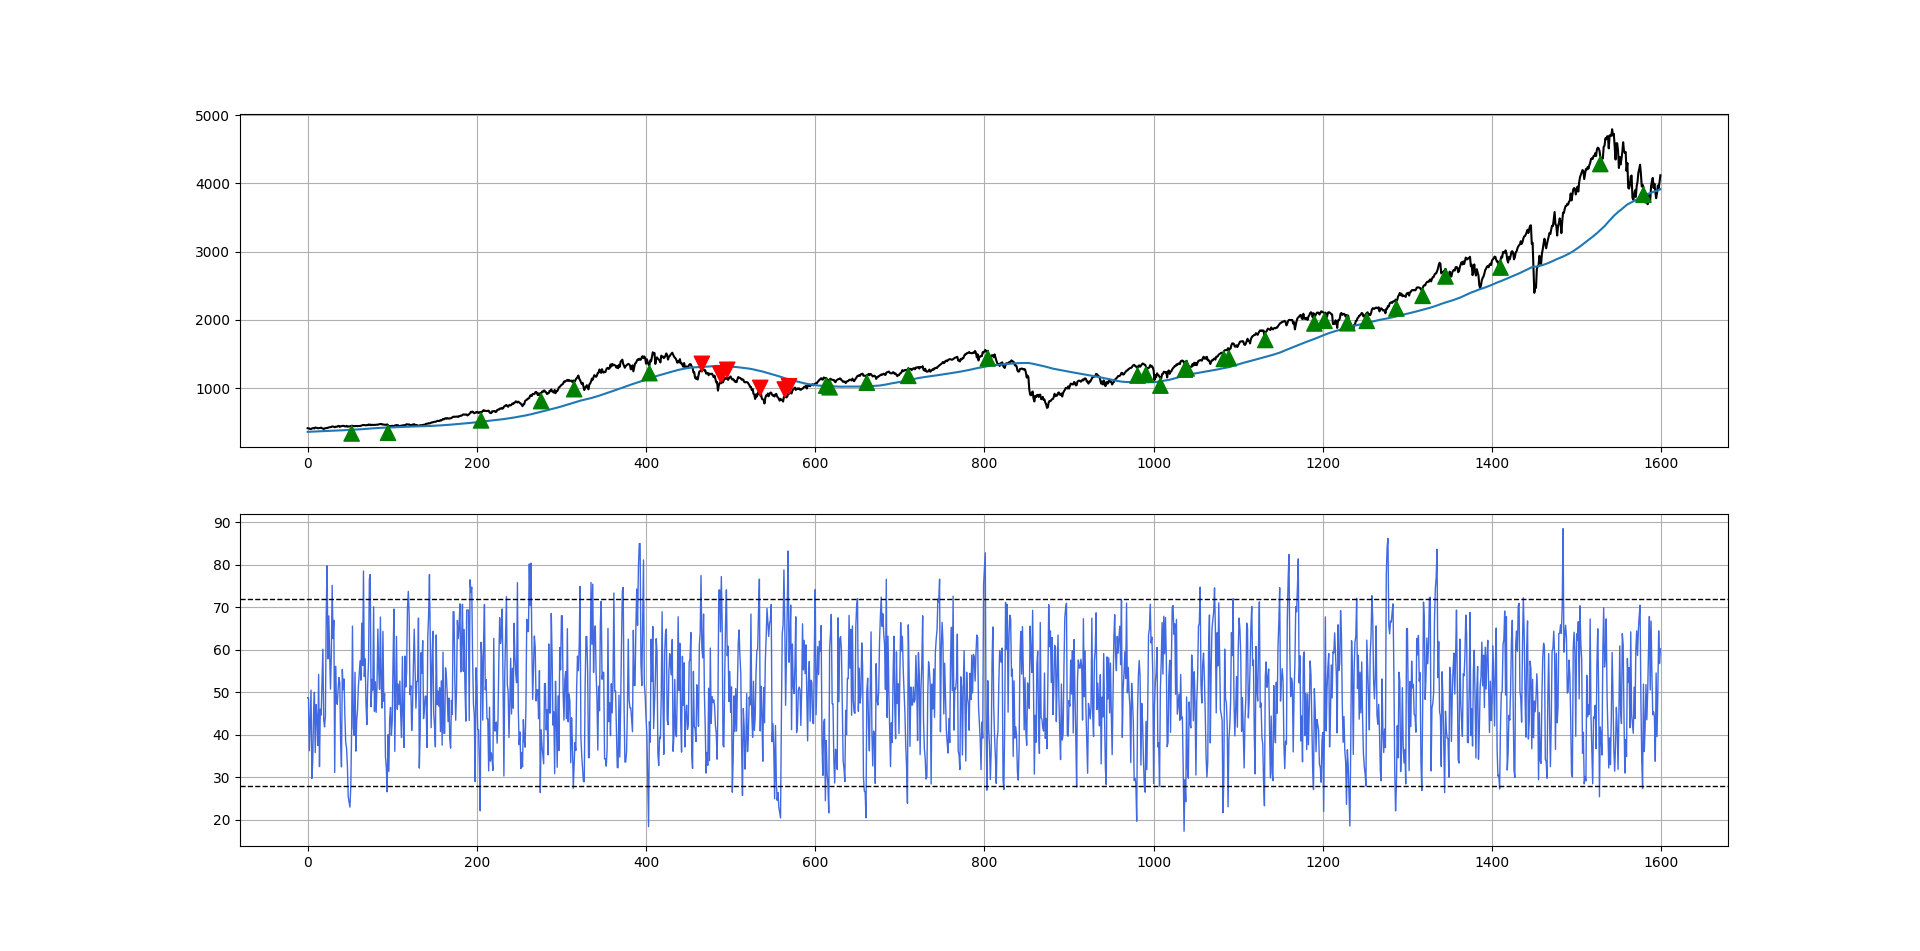
The AAII is an equity-based sentiment indicator published by the American Association of Individual Investors. The strategy used combines it with the RSI and a 100-Day moving average.
The following Figure shows the recent signal chart.
Conclusion
The model is continuously scanning for a new opportunity. In case a signal is found, an update will be sent to the subscriber.
Historical Track Record
The next table shows the historical non-binding track record of the model. Remember that past results are not representative of future results.
The COT Meter
The U.S Commodity Futures Trading Commission (CFTC) publishes statistics of the futures market on a weekly basis called the Commitment of Traders (COT) report. The report has many valuable information inside, namely the number of futures contracts held by market participants (hedge funds, banks, producers of commodities, speculators, etc.).
Two main categories have to be distinguished before going further:
Commercial players: They deal in the futures markets for hedging purposes (i.e. to cover their operations or other trading positions). Examples of hedgers include investment banks and agricultural giants. Their positions are negatively correlated with the underlying market.
Non-commercial players: They deal in the futures markets for speculative reasons (i.e. to profit from their positions). Examples of speculators include hedge funds. Their positions are positively correlated with the underlying market.
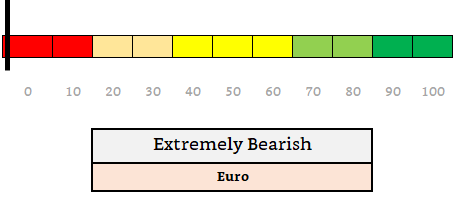
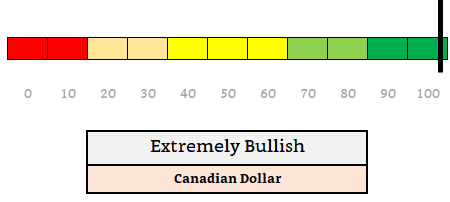
The COT meter takes the difference between the net non-commercial players and the net commercial players in order to get a final net value which is supposed to be positively correlated to the underlying asset.
For example, if the Canadian Dollar is showing an extreme value of 100, then this means that taking into account the past 52 weeks, the net market positioning has been overly bullish which could mean that a correction may be likely.
The COT meter is not really a signal indicator but is useful in knowing how much the positioning is when compared to a scale beteen 0 and 100.
COT Pattern Recognition
The COT pattern recognition system considers the strong correlation between the net COT values and the followed financial instrument. For example, there is a positive correlation between the net EUR COT value and the EURUSD pair. In contrast, there is a negative correlation between the net CAD COT value and the USDCAD pair. The following are the signals detected with the respective track record.
The following shows the signals on EUR COT:
The following shows the signals on CHF COT:
The following shows the signals on JPY COT:
The following shows the signals on CAD COT:
Important Legal Disclaimer
Every information contained in the report is solely for the purpose of showing another angle. Since it is NOT investment advice or trade recommendations, you must NOT use the report as the sole reason for your trading and investing activities.
Make sure you know how to include the above elements in your trading framework in a way that does not change your methodology but in a way that gives you conviction on your pre-existing ideas.
Data can have many representations and the information presented is but one side of the story which may be incomplete. All back-testing and forward testing results reflect their own time period and not the future as is the case in every research piece.
The information contained in the report are proprietary and only YOU are permitted to use it. If you have to share it, please state the source correctly by referring the page of the Newsletter.


