


The Weekly Market Sentiment Report: 6th January - 10th January 2025
The Weekly Market Sentiment Report: 06/01/2025 - 10/01/2025

CONTENTS
EVOLUTION & NATURE OF THE REPORT
ECONOMIC CALENDAR
MARKET SNAPSHOT
SPOTLIGHT
THE COT REPORT STRATEGY
PUT-CALL RATIO SENTIMENT INDEX
THE GAMMA EXPOSURE INDEX
THE MOVING AVERAGE PERCENTAGE INDEX
THE RSI PERCENTAGE INDEX
EQUITY YEARLY MILESTONE INDEX
THE S&P 500 VOLATILITY BAND INDEX 🆕
VOLATILITY INDICES
IMPLIED CORRELATION INDEX
BOFA HIGH YIELD INDEX
INFLATION RATE MID-TERM MODEL
BITCOIN FEAR & GREED INDEX
THE AAII INVESTOR SENTIMENT SURVEY
THE ISM PURCHASING MANAGER’S INDEX (ISM PMI)
THE COT REPORT STRATEGY TRACK RECORD
CORRELATION HEATMAP
CLOSED OPPORTUNITIES
DISCLAIMER

EVOLUTION & NATURE OF THE REPORT
New sentiment models are constantly added while taking into account their overall utility. Feel free to leave a feedback (e.g. nature of the document, its usefulness, its time interval, its content, language, etc.).
The directional views are represented using the following convention and are followed by their charts:
⚡ This symbol represents a new tactical directional opportunity.
🔁 This symbol represents an on-going tactical directional opportunity.
✅ This symbol represents a recently closed tactical opportunity at a profit.
❌ This symbol represents a recently closed tactical opportunity at a loss.
⛓️💥 This symbol represents a neutralized opportunity before seeing its target due to new conflicting technical elements (if the view is neutralized at a loss compared to its entry price, it will be considered as a loss and will have the symbol from the previous step).
The directional views presented must simply be used to help confirm the overall expected direction of the analyzed market. The support and resistance zones are not hard levels, they are merely areas of expected reactions (reversals), and hence for risk management purposes, you are advised to place your stops as you see fit. Some noise may occur around the support and resistance levels.
If you want to see more explanatory details on the report, you can refer to the following post:
ECONOMIC CALENDAR
An economic calendar is a tool used in finance and economics to track and display upcoming economic events, announcements, and indicators that are relevant to the financial markets and the broader economy. The following shows what to expect for the coming week:

MARKET SNAPSHOT
The below table summarizes the weekly percentage changes of the key markets:

This week, EURUSD moved around -1.55 % while equity markets shaped a -0.62 % move as evidenced by the S&P 500 index. Meanwhile, Bitcoin had a 4.89 % move. The safe haven proxy Gold shaped a 1.06 % move. On the fixed income part, Tnote-10 shaped a 0.19 %. Lastly, oil had a performance of 4.76 %.
SPOTLIGHT
The following points summarize the key ideas you need to know for the report:
🗞️ The following markets have been added to the COT report strategy [US Bond, Silver, Natural Gas, Lumber, Palladium, Aluminum].
🗞️ A new indicator has been added to the report. The main aim is to show the percentage of stocks that are under their lower volatility band. Further details are explained in the section.
🗞️ The mixed view on EURUSD remains with sentiment indicators pointing to a possible recovery.
🗞️ Added the average risk-reward ratio and the total number of trades since inception to the COT report strategy’s track record.
THE COT REPORT STRATEGY
The CFTC publishes statistics of the futures market on a weekly basis called the Commitment of traders (COT) report. The report has many valuable information inside, namely the number of futures contracts held by market participants (hedge funds, banks, producers of commodities, speculators, etc.). Two main categories in the COT report must be distinguished:
Commercial players: They deal in the futures markets for hedging purposes (i.e. to cover their operations or other trading positions). Examples of hedgers include investment banks and agricultural giants. Their positions are negatively correlated with the underlying market.
Non-commercial players: They deal in the futures markets for speculative reasons (i.e. to profit from their positions). Examples of speculators include hedge funds. Their positions are positively correlated with the underlying market.
The COT report strategy is the core of this report. It highlights the markets that are overbought or oversold with regards to sentiment. The following table summarizes the current state of the sentiment for currencies and indices:
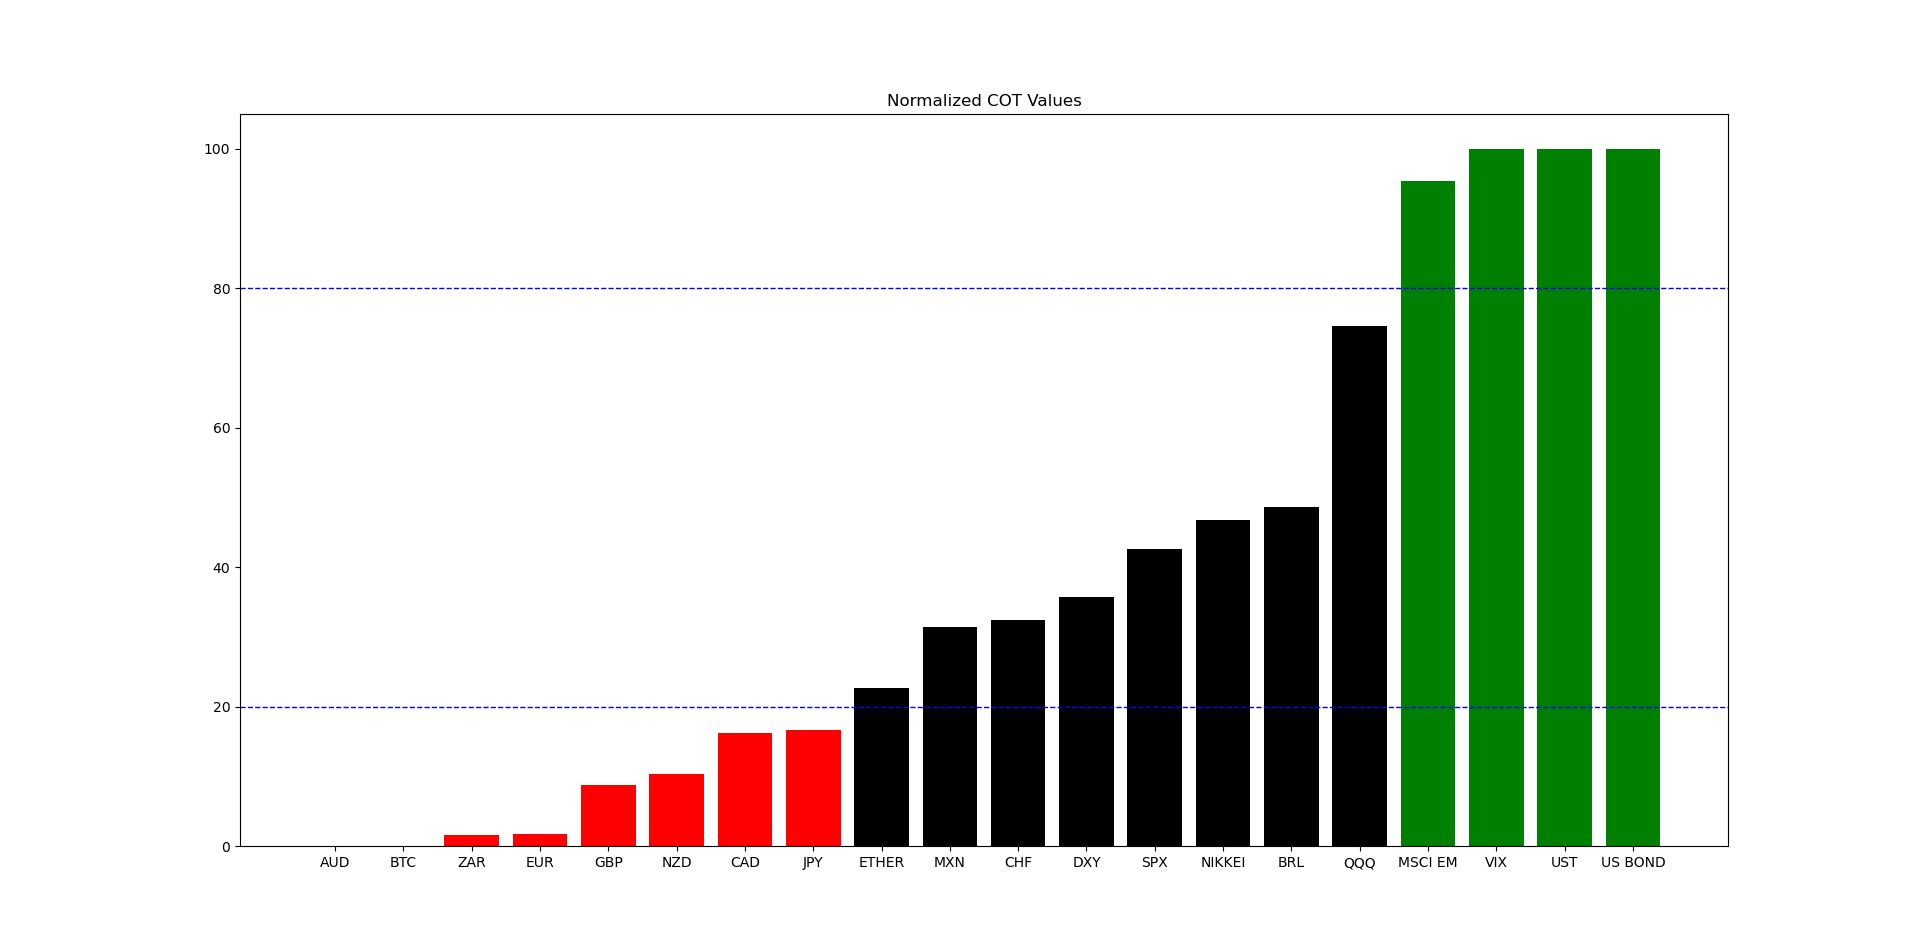
Make sure to remember that theses are not advices whatsoever, they are merely charts that fuse sentiment analysis with technical analysis:
⚡ BTCUSD: Bullish reaction expected around 92,270/88,500 to 108,000.
⚡ AUDBRL: Bullish reaction expected around 3.81/3.74 to 4.01.
🔁 EURCHF: Bullish reaction expected around 0.9350/0.9300 to 0.9500.
🔁 US 10-YEAR YIELDS: Bearish reaction expected around 4.63/4.74 to 4.32.
🔁 AUDCAD: Bullish reaction expected around 0.8950/0.8900 to 0.9095.
❌ EURCAD: View invalidated (see Closed Opportunities section).


💡 The views are found by combining different markets together. For example, if the EUR has an extremely bearish sentiment and the CAD has an overly bullish sentiment, then a bullish position on EURCAD can be interesting if the technical elements justify it.
💡 The track record of the COT report strategy can be found at the end of the newsletter.
The following table summarizes the current state of the sentiment for commodities:
Keep reading with a 7-day free trial
Subscribe to The Weekly Market Sentiment Report to keep reading this post and get 7 days of free access to the full post archives.