🎄The Weekly Market Sentiment Report: 23rd December - 27th December 2024🎄
The Weekly Market Sentiment Report: 23/12/2024 - 27/12/2024
CONTENTS
EVOLUTION & NATURE OF THE REPORT
ECONOMIC CALENDAR
MARKET SNAPSHOT
SPOTLIGHT
THE COT REPORT STRATEGY
PUT-CALL RATIO SENTIMENT INDEX
THE GAMMA EXPOSURE INDEX
THE MOVING AVERAGE PERCENTAGE INDEX
THE RSI PERCENTAGE INDEX
EQUITY YEARLY MILESTONE INDEX
IMPLIED CORRELATION INDEX
VOLATILITY INDICES
BOFA HIGH YIELD INDEX
INFLATION RATE MID-TERM MODEL 🆕
THE AAII INVESTOR SENTIMENT SURVEY
THE ISM PURCHASING MANAGER’S INDEX (ISM PMI)
THE COT REPORT STRATEGY TRACK RECORD 🆕
CORRELATION HEATMAP
CLOSED OPPORTUNITIES
DISCLAIMER
EVOLUTION & NATURE OF THE REPORT
New sentiment models are constantly added while taking into account their overall utility. Feel free to leave a feedback (e.g. nature of the document, its usefulness, its time interval, its content, language, etc.).
The directional views are represented using the following convention and are followed by their charts:
⚡ This symbol represents a new tactical directional opportunity.
🔁 This symbol represents an on-going tactical directional opportunity.
✅ This symbol represents a recently closed tactical opportunity at a profit.
❌ This symbol represents a recently closed tactical opportunity at a loss.
⛓️💥 This symbol represents a neutralized opportunity before seeing its target due to new conflicting technical elements (if the view is neutralized at a loss compared to its entry price, it will be considered as a loss and will have the symbol from the previous step).
The directional views presented must simply be used to help confirm the overall expected direction of the analyzed market. The support and resistance zones are not hard levels, they are merely areas of expected reactions (reversals), and hence for risk management purposes, you are advised to place your stops as you see fit. Some noise may occur around the support and resistance levels.
If you want to see more explanatory details on the report, you can refer to the following post:
ECONOMIC CALENDAR
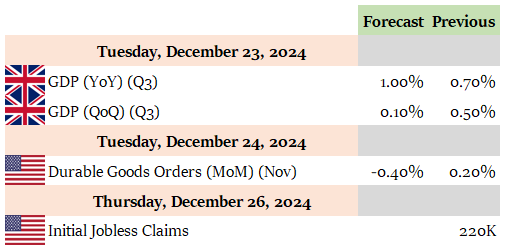
An economic calendar is a tool used in finance and economics to track and display upcoming economic events, announcements, and indicators that are relevant to the financial markets and the broader economy. The following shows what to expect for the coming week:
MARKET SNAPSHOT
The below table summarizes the weekly changes of some of the key markets:
SPOTLIGHT
The following summarize the key points you need to know for the report:
🎄Merry christmas! This week’s sentiment report will be accessible to all subscribers as a holidays gift.
🗞️ A new inflation model has been added to this report. It has a long-term nature and seeks to help with equity forecasts.
🗞️ A new sentiment indicator relating to high-yield bonds has been added to this report. It seeks to relate risk-on and risk-off scenarios with USD forecasts.
🗞️ The EURUSD moving average percentage index has finally surpassed 25% bullish level, thus confirming a phase of recovery on EURUSD. Additionally, the EURUSD RSI index has also confirmed a bullish recovery.
🗞️ Many indicators are pointing to a stop in the correction of the S&P 500 and a start of a recovery. Further details in the report.
🗞️ The number of stocks above their 1-year high continue to plummet.
🗞️ Added the average risk-reward ratio and the total number of trades since inception to the COT report strategy’s track record.
THE COT REPORT STRATEGY
The CFTC publishes statistics of the futures market on a weekly basis called the Commitment of traders (COT) report. The report has many valuable information inside, namely the number of futures contracts held by market participants (hedge funds, banks, producers of commodities, speculators, etc.). Two main categories in the COT report must be distinguished:
Commercial players: They deal in the futures markets for hedging purposes (i.e. to cover their operations or other trading positions). Examples of hedgers include investment banks and agricultural giants. Their positions are negatively correlated with the underlying market.
Non-commercial players: They deal in the futures markets for speculative reasons (i.e. to profit from their positions). Examples of speculators include hedge funds. Their positions are positively correlated with the underlying market.
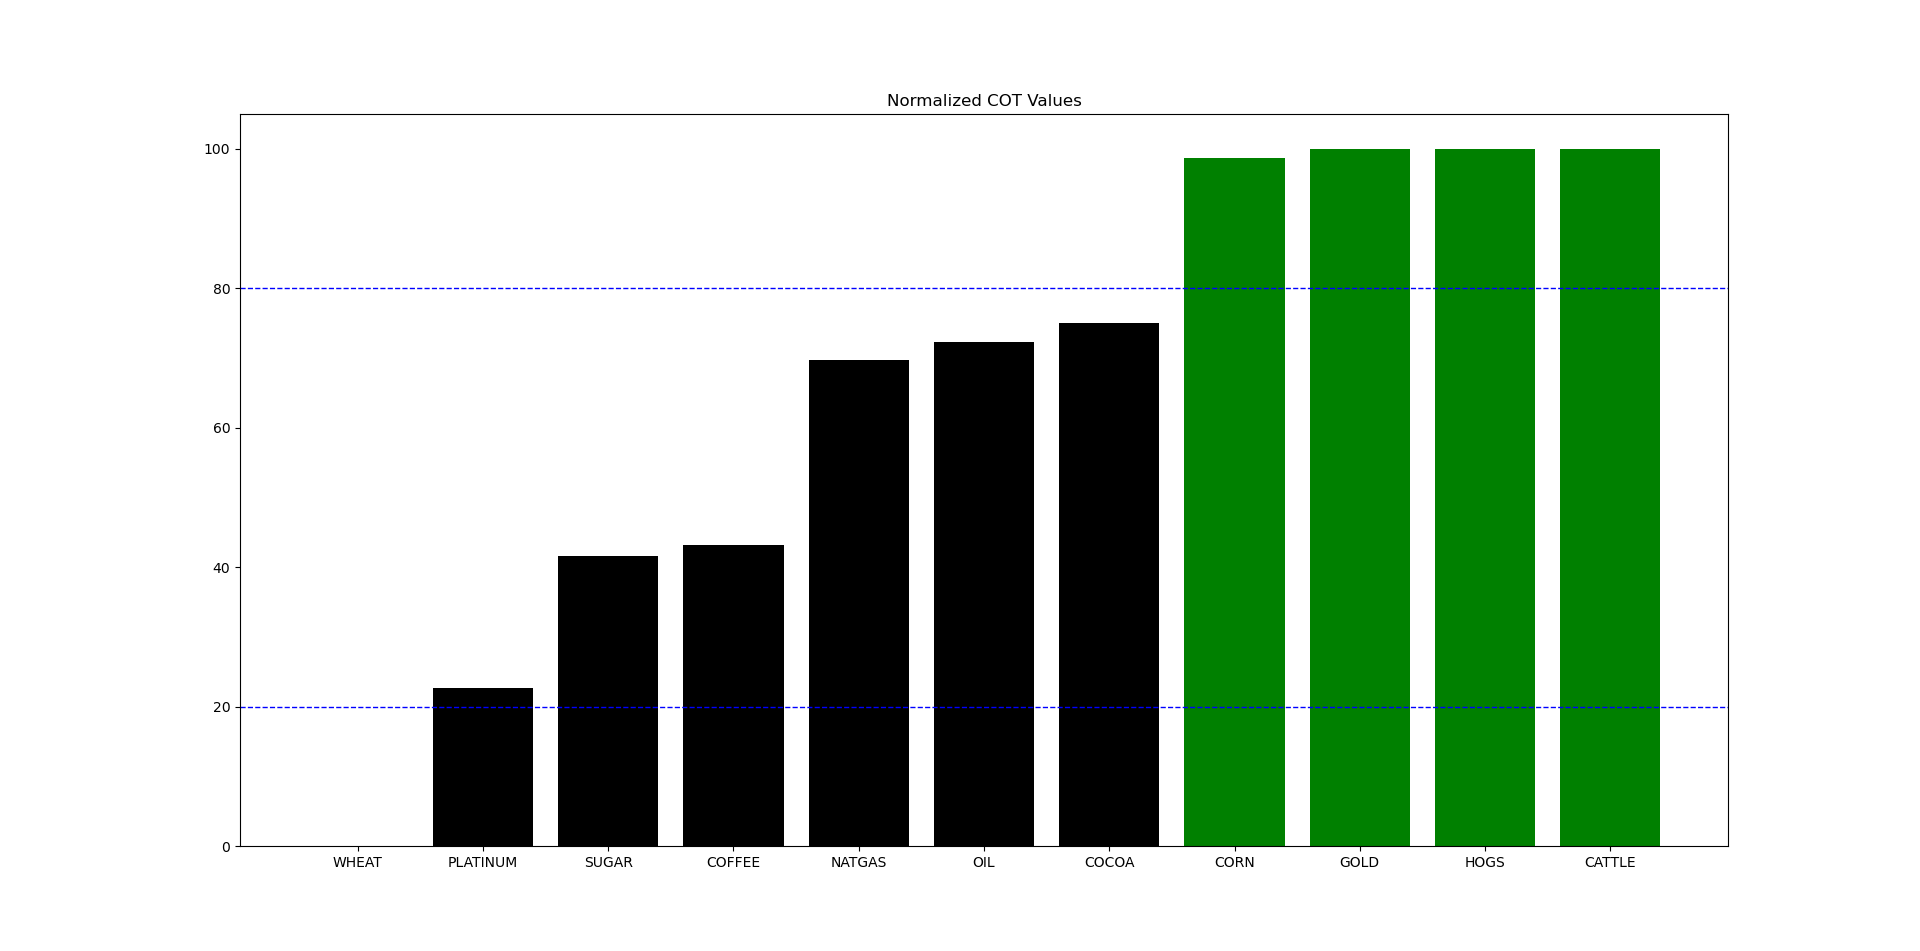
The COT report strategy is the core of this report. It highlights the markets that are overbought or oversold with regards to sentiment. The following table summarizes the current state of the sentiment for currencies and indices:
Make sure to remember that theses are not advices whatsoever, they are merely charts that fuse sentiment analysis with technical analysis:
⚡ US 10-YEAR YIELDS: Bearish reaction expected around 4.63/4.74 to 4.32.
⚡ AUDCAD: Bullish reaction expected around 0.8980/0.8930 to 0.9095.
🔁 EURZAR: Bullish reaction expected around 18.78/18.60 to 19.39.
🔁 MXNZAR: Bullish reaction expected around 0.8820/0.8675 to 0.9260.
⛓️💥 GBPJPY: View neutralized as the target was reached before approaching/seeing the entry zone.
✅ EURMXN: Potential seen/approached (see Closed Opportunities section).
✅ USDZAR: Potential seen/approached (see Closed Opportunities section).
✅ EURJPY: Potential seen/approached (see Closed Opportunities section).
✅ USDJPY: Potential seen/approached (see Closed Opportunities section).
❌ NZDUSD: View invalidated (see Closed Opportunities section).
❌ EURAUD: View invalidated (see Closed Opportunities section).
❌ EURUSD: View invalidated (see Closed Opportunities section).
💡 The views are found by combining different markets together. For example, if the EUR has an extremely bearish sentiment and the CAD has an overly bullish sentiment, then a bullish position on EURCAD can be interesting if the technical elements justify it.
💡 The track record of the COT report strategy can be found at the end of the newsletter.
The following table summarizes the current state of the sentiment for commodities:
Make sure to remember that theses are not advices whatsoever, they are merely charts that fuse sentiment analysis with technical analysis:
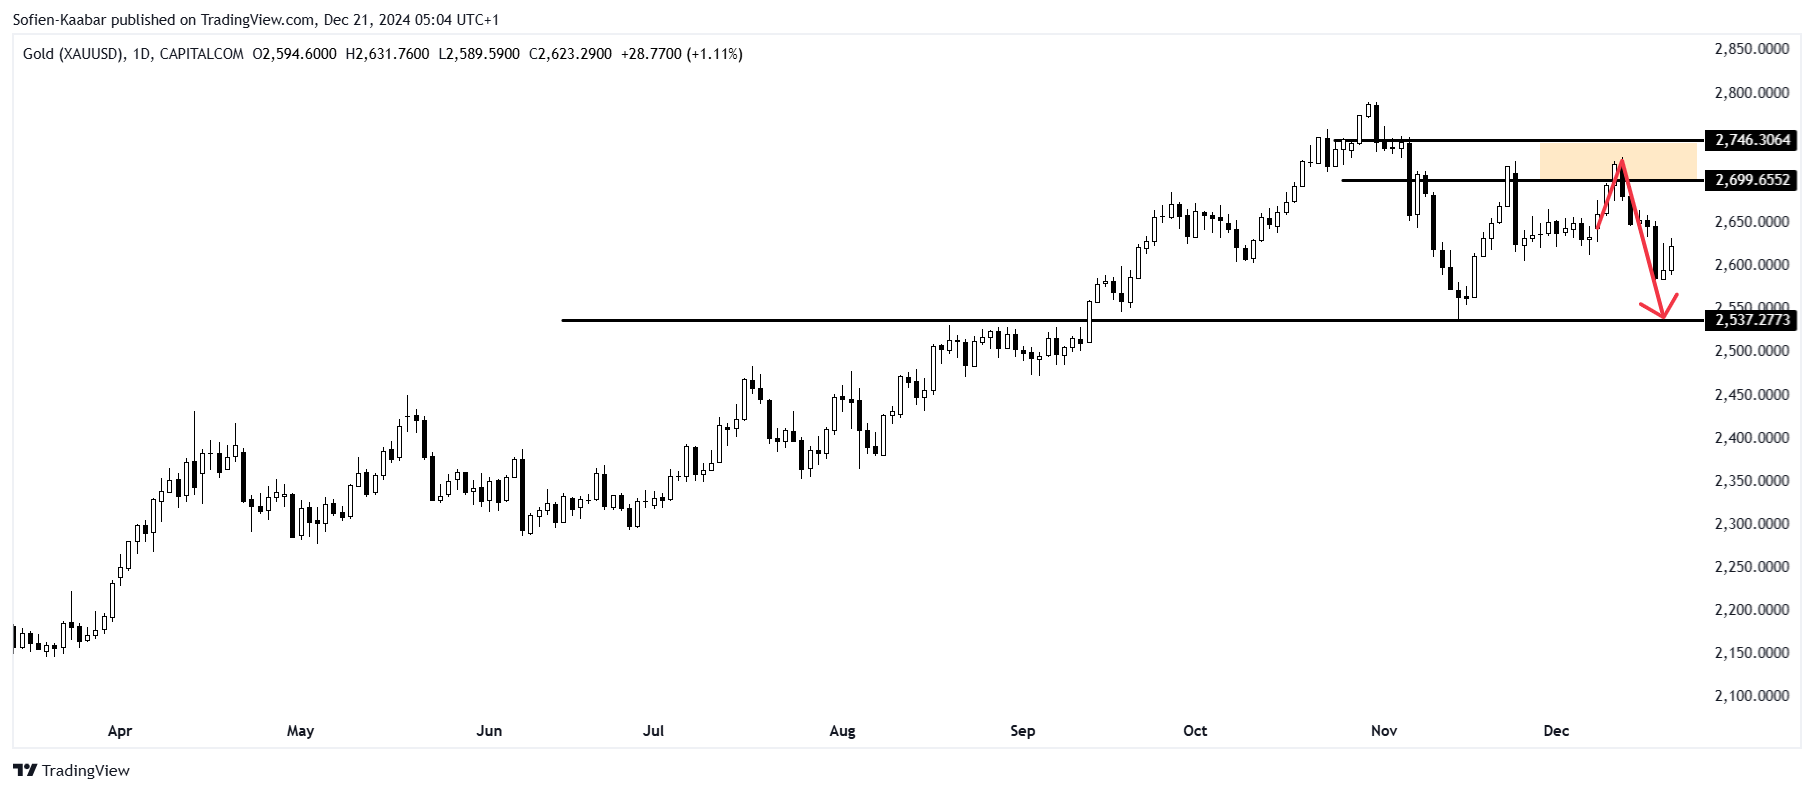
🔁 GOLD: Bearish reaction expected around 2699/2746 to 2517.
🔁 CATTLE: Bearish reaction expected around 1.8967/1.9189 to 1.7969.
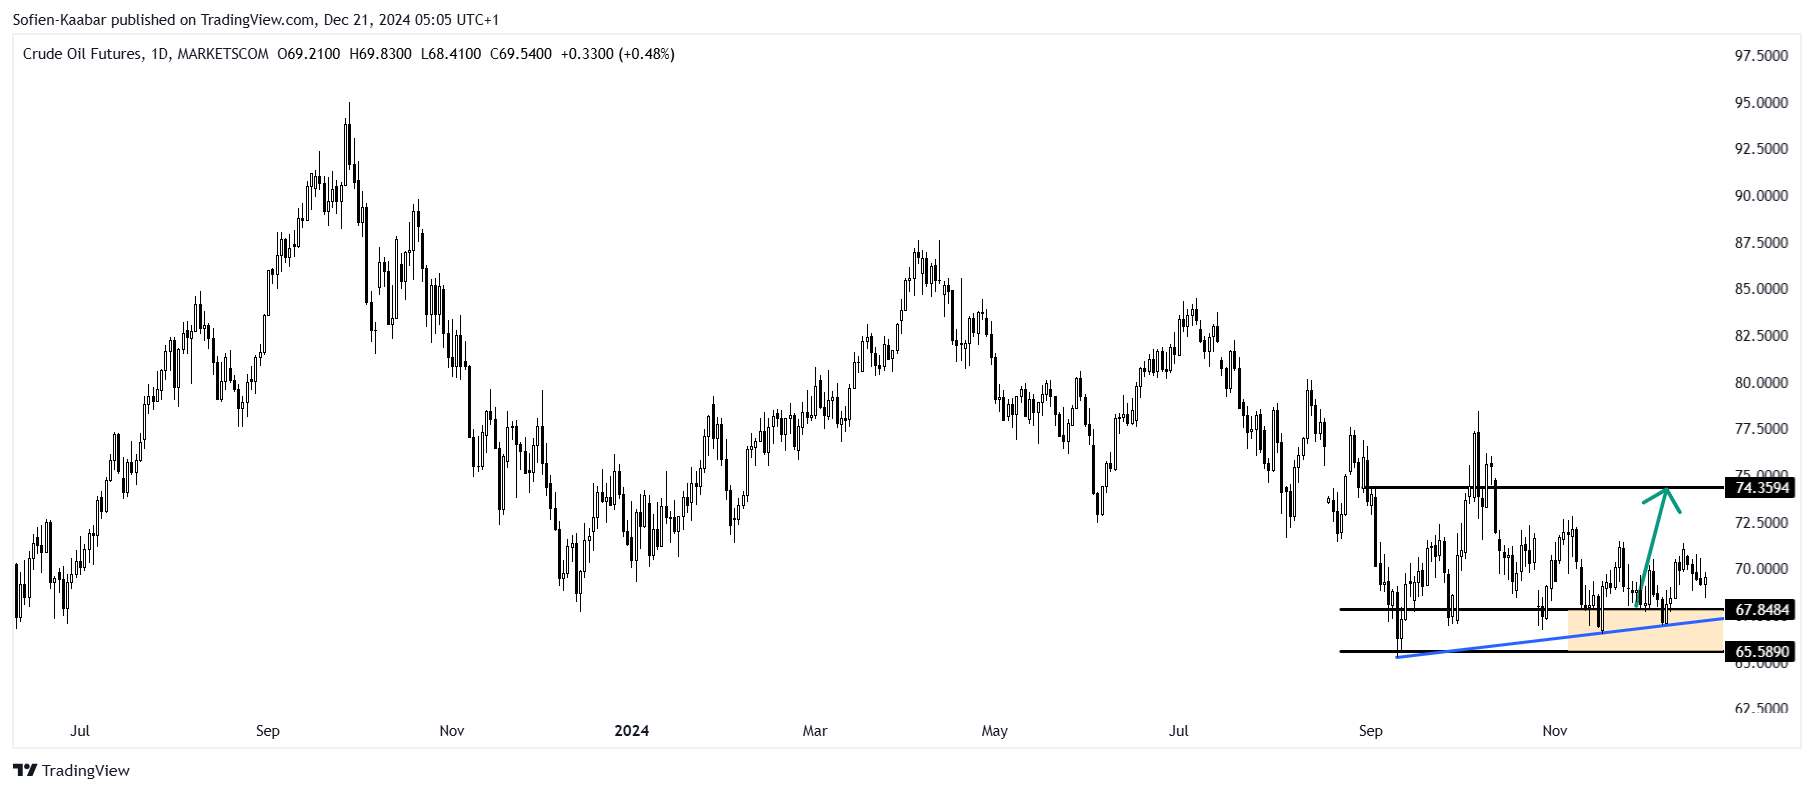
🔁 CRUDE OIL: Bullish reaction expected around 67.84/65.58 to 74.35.
🔁 WHEAT: Bullish reaction expected around 520/507 to 568.
❌ CORN: View invalidated (see Closed Opportunities section).
❌ COCOA: View invalidated (see Closed Opportunities section).
PUT-CALL RATIO SENTIMENT INDEX
The equity put-call ratio (PCR), published by the CBOE gives insights to the current market anxiety. It is the number of puts divided by the number of calls. Historically, the correlation with the stock market (S&P 500) has been intuitively negative at ~ -0.40 using the Spearman rank correlation and ~ -0.32 using the Pearson correlation coefficient.
💡 Correlation is a statistical measure that tells us if there's a relationship between two variables and how strong that relationship is.
💡 Pearson correlation is used when both variables are continuous and follow a linear relationship, meaning when one variable goes up, the other tends to go up or down predictably. Spearman correlation, on the other hand, is used when the relationship is not necessarily linear.
Additionally, the maximal information coefficient (MIC) which measures the degree of non-linear relationship is ~ 0.20, which suggests there is a relationship between the two time series (whether negative or positive). The following chart shows the current and past signals.
Interpretation 🔎: The scanner is still in neutral stance.
Reminder, the following are the results of the strategy so far:
Total hit ratio = 78.26% | Gross profit factor = 4.21 | Number of signals = 46
THE GAMMA EXPOSURE INDEX
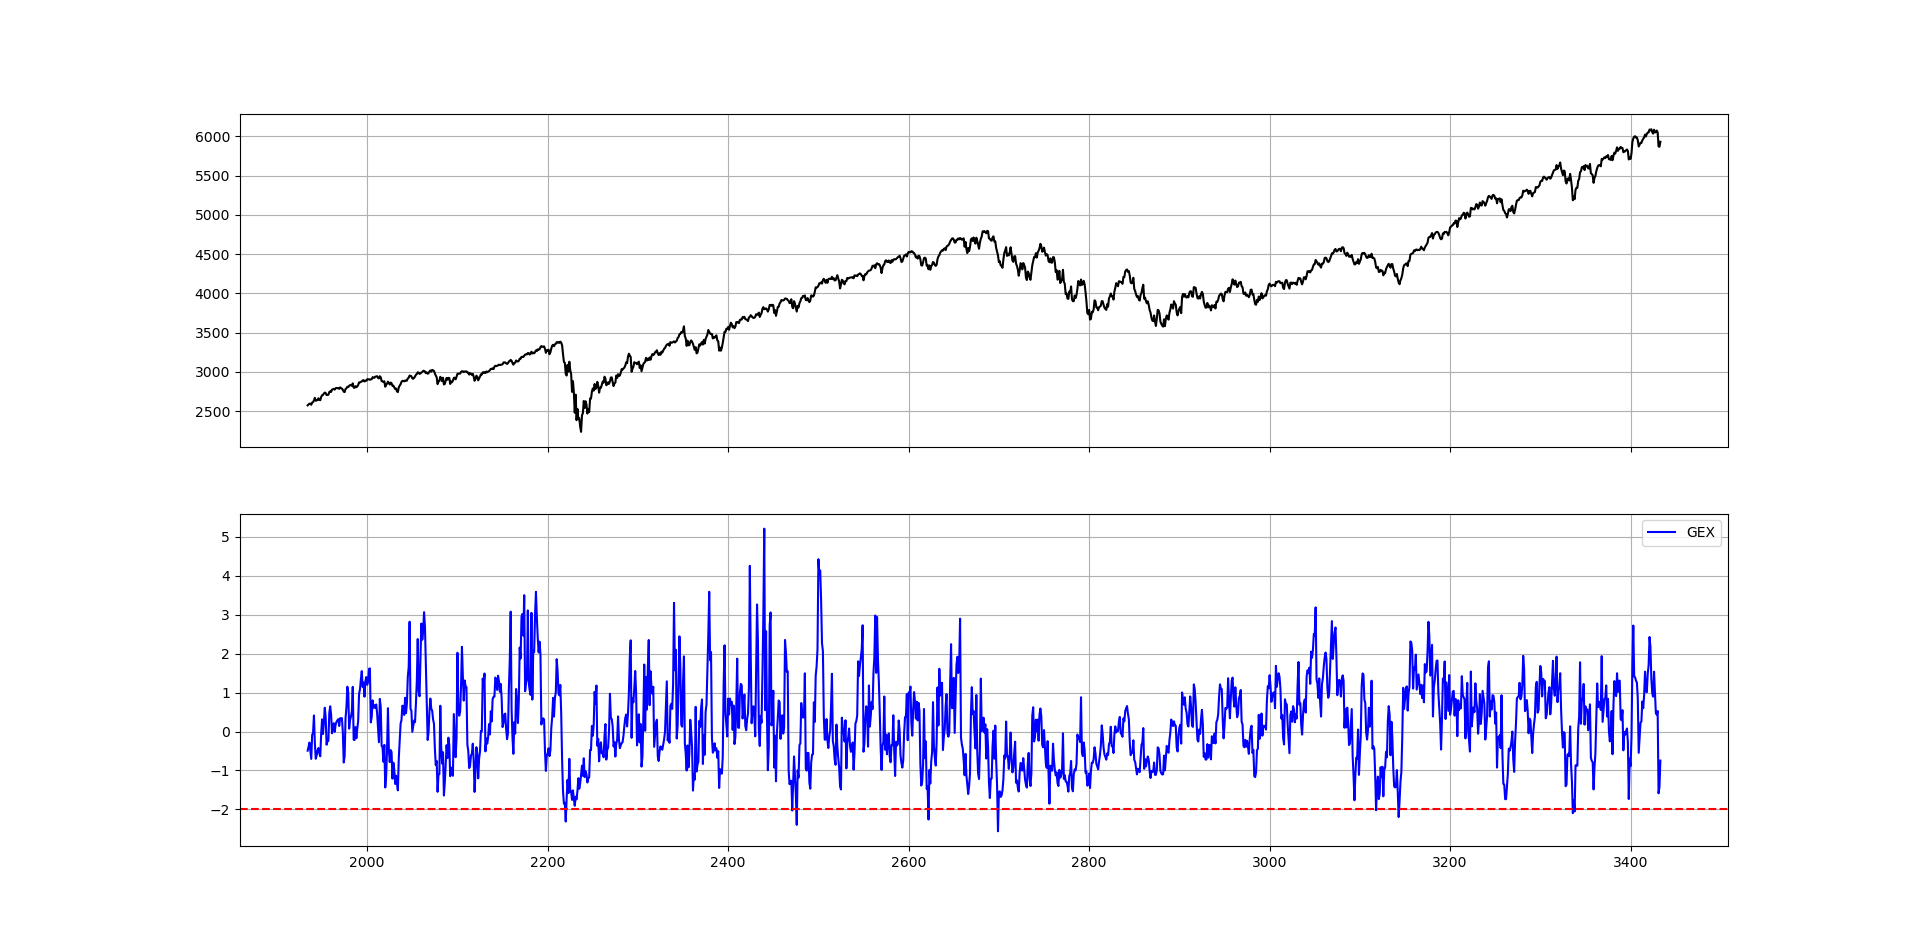
The gamma exposure index (GEX) is a measure used in the options market to assess the sensitivity of the market's gamma exposure to price changes. Essentially, gamma provides insight into the convexity or curvature of the option's price in relation to movements in the underlying asset's price.
The GEX quantifies this gamma exposure across a market or a specific underlying asset. A higher GEX suggests a greater sensitivity of the market to price changes, indicating potential volatility due to hedging activities. Conversely, a lower GEX suggests less sensitivity and potentially lower volatility. The correlation between the S&P 500 and the GEX is quite high, which may give interesting timing opportunities.
Here’s how I use the GEX:
A bullish signal is generated whenever the 200-day normalized value of the index reaches the area of around -2.00.
A bearish signal is generated whenever the 200-day normalized value of the index reaches the area of around +2.00. It is worth noting that the bearish signals have a low conviction.
The following chart shows the current GEX situation.
Interpretation 🔎: After this week’s strong correction seen on the S&P 500, the GEX is approaching -2.00 and is around -1.00. Reminder, only touching -2.00 yields a bullish signal from the GEX. Other indicators are also pointing to the fact that the S&P 500’s correction will be limited and soon will rebound.
THE MOVING AVERAGE PERCENTAGE INDEX
The first index calculates the percentage of stocks in the S&P 500 that are above their 50-Day moving average. A rule of thumb of this index is to use it as follows:
A bullish signal is generated whenever the index surpasses 20%, thus indicating that more stocks are surpassing their moving average.
A bearish signal is generated whenever the index breaks 80%, thus indicating that more stocks are breaking their moving average.
The following shows the evolution of the index versus the S&P 500.
Interpretation 🔎: During a predominantly bullish trend, if the index approaches once again the 20% level, a strong bullish signal is generated and a rotation to US stocks will be heavily recommended. Currently, the index is back around 20% prompting a bullish view from this indicator.
The second index calculates the percentage of the USD major crosses that are above their 20-Day moving average. A rule of thumb of this index is to use it as follows:
A bullish signal is generated whenever the index surpasses 25%, thus indicating that more USD pairs are surpassing their moving average.
A bearish signal is generated whenever the index breaks 75%, thus indicating that more USD pairs are breaking their moving average.
The following shows the evolution of the index versus EURUSD.
Interpretation 🔎: The index has finally surpassed 25% bullish level, thus confirming a phase of recovery on EURUSD. However, this week’s reaction on EURUSD was mostly driven by the FOMC’s rate decision. Therefore, currently the indicator is still arguing for a bullish reaction on this FX pair as long as it is above 25%.
Reminder, the following are the results of the strategy so far:
Total hit ratio = 64.58% | Gross profit factor = 2.68 | Number of signals = 48
EQUITY RSI SENTIMENT INDEX
The first index uses a formula that involves the relative strength index (RSI) of the totality of the S&P 500’s components. A rule of thumb of this index is to use it as follows:
A bullish signal is generated whenever the index reaches -45.
A bearish signal is generated whenever the index reaches +45.
The following shows the evolution of the index versus the S&P 500.
Interpretation 🔎: The index reached -45 and is showing a bullish preference for the equity market to start recovering from the correction seen this week.
The second index uses a formula that involves the relative strength index (RSI) of the USD major currency pairs. A rule of thumb of this index is to use it as follows:
A bullish signal is generated whenever the index reaches -60.
A bearish signal is generated whenever the index reaches 60.
The following shows the evolution of the index versus EURUSD.
Interpretation 🔎: The index reached -60 prompting a bullish view in support for the movign average index. Expecting EURUSD to bounce/recover despite breaking its support from last week.
IMPLIED CORRELATION INDEX
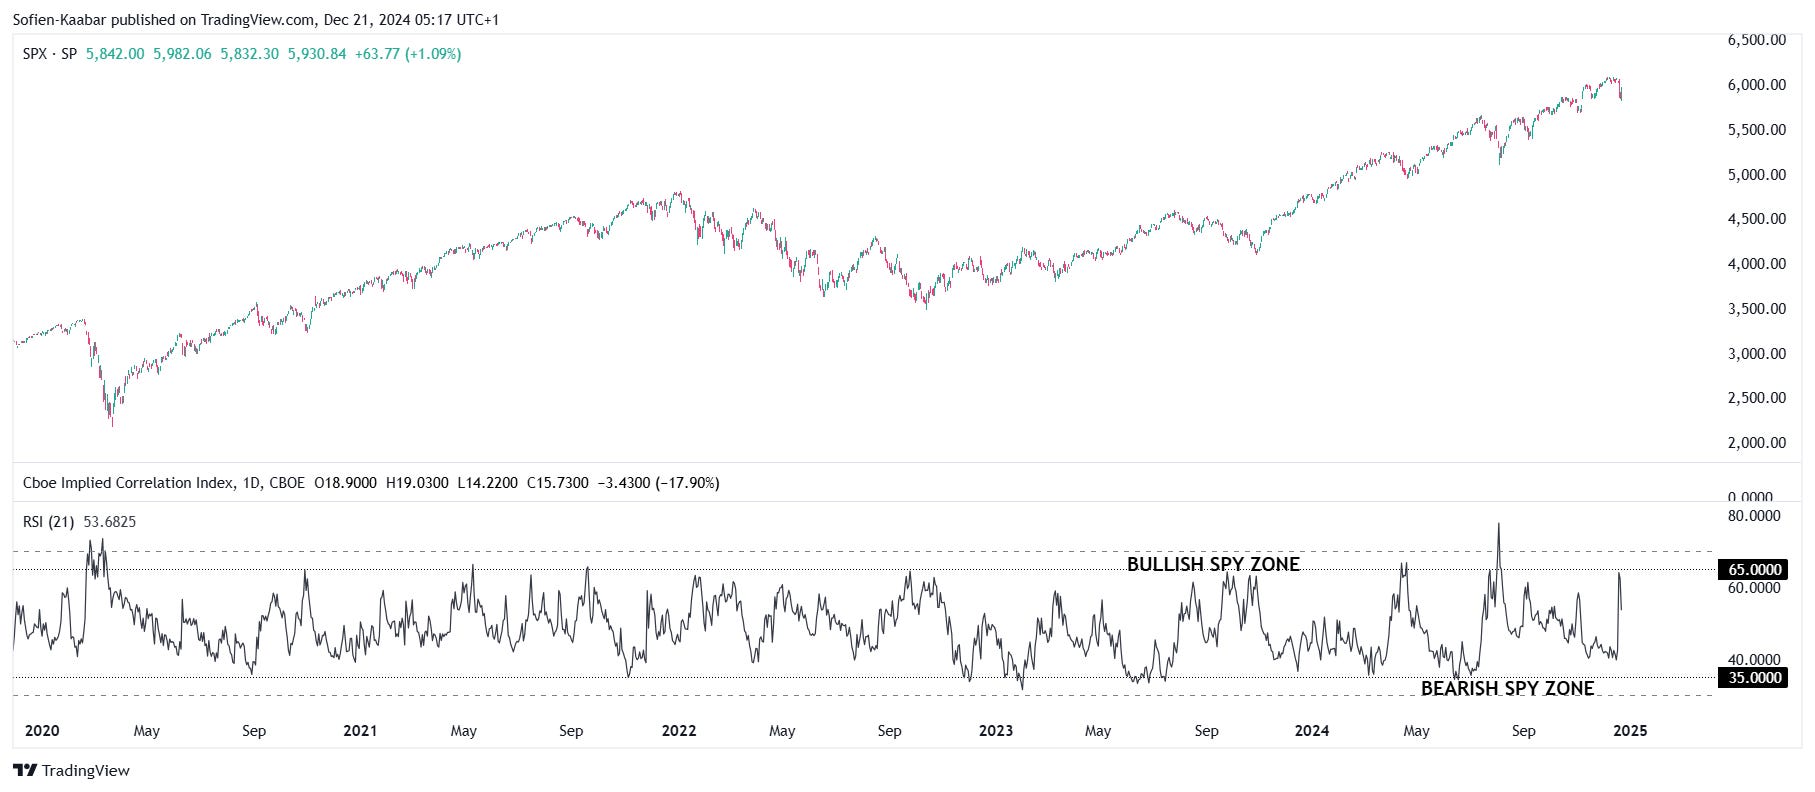
The CBOE Implied Correlation Index (ICJ) is a financial market indicator designed to measure the average correlation between the largest U.S. stocks, based on options pricing. It provides insights into market dynamics, particularly about diversification, market sentiment, and systemic risk. It has a negative correlation to the S&P 500, thus carries a certain predictive power.
This index calculates a 21-day RSI on the ICJ in order to detect local (tactical) tops and botttoms on the S&P 500.
The following shows the evolution of the index versus the S&P 500.
Interpretation 🔎: The area between 35-40 correlates to periods where the S&P 500 corrects to the downside and the area between 65-70 correlates to periods where the S&P 500 recovers. Currently, the index bounced sooner than expected and quickly reached 65, which suggests a bullish bias on equities.
EQUITY YEARLY MILESTONE INDEX
This index simply calculates the percentage of stocks in the S&P 500 that are above their close from one year ago. This indicator is non-directional, meaning that it doesn’t predict the direction of the S&P 500, but simply states a fact on the health of the market.
The following shows the evolution of the index versus the S&P 500.
Interpretation 🔎: The number of stocks at a 1-year high has broken the threshold of 75% in an indication of a possible cool-down in stocks. This is a non-directional index despite it’s warning that more and more stocks are struggling to continue higher.
VOLATILITY INDICES
Two volatility indicators are discussed in this section. The CBOE Volatility Index (VIX) is a popular measure of the stock market's expectation and sentiment of volatility implied by S&P 500 index options. It tends to rise when investors expect significant near-term volatility in the stock market. The VIX is calculated using the prices of a wide range of S&P 500 index options. These prices reflect investors' expectations for future volatility over the next 30 days.
Historically, the VIX and the SPX have an inverse relationship. When the SPX declines, the VIX tends to rise, and when the SPX rises, the VIX tends to fall. When the stock market declines, fear and uncertainty increase among investors, leading to higher demand for options to hedge against further declines. This drives up the prices of options, increasing the VIX.
The CBOE EuroCurrency Volatility Index (EUVIX) is a measure of the market's expectations of 30-day volatility of the Euro/U.S. Dollar (EUR/USD) exchange rate. This index is derived from the prices of options on the EUR/USD currency pair and is similar in concept to the VIX (CBOE Volatility Index) which measures the volatility of the S&P 500 index.
The index is calculated using the prices of various options on the EUR/USD currency pair. These options prices reflect the market's consensus on the likelihood of different outcomes for the currency exchange rate.
Technically speaking, the indices have the following technical configurations.
Interpretation 🔎: Last week, the VIX accurately predicted the correction on the S&P 500 after bouncing from its support (see last week’s report). Currently, the VIX is reacting from its resistance giving off a bullish vibe on the S&P 500. The EVZ is between levels and not showing a meaningful pattern.
BOFA HIGH YIELD INDEX
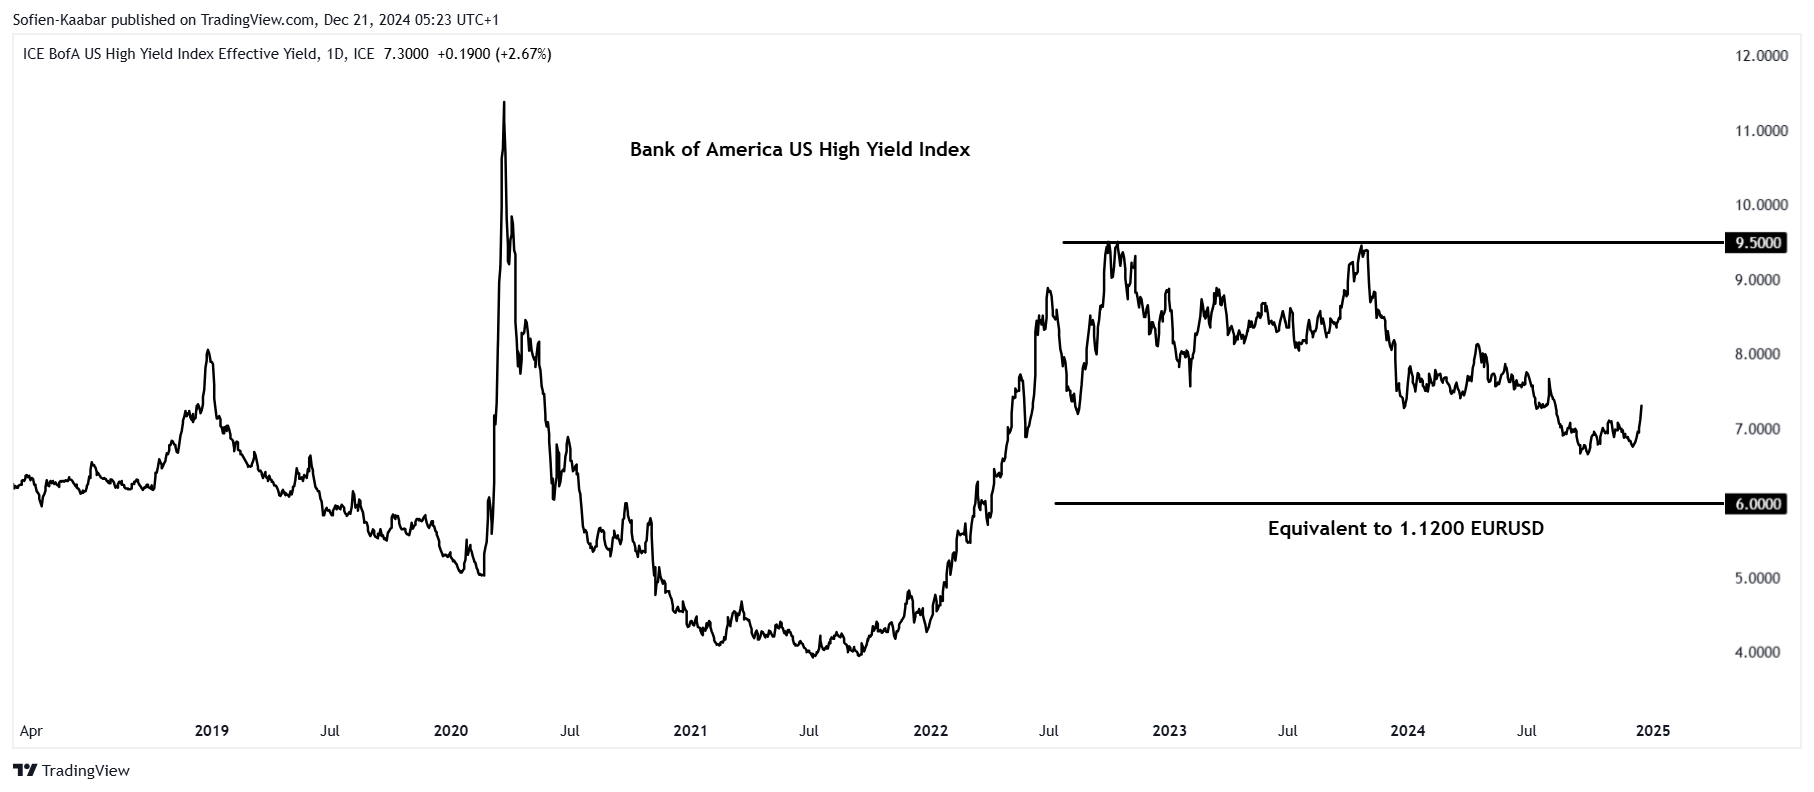
The Bank of America High Yield Index US, often referred to as the BofA High Yield Index, is a benchmark used to measure the performance of the U.S. high-yield (junk) bond market. High-yield bonds are corporate bonds that have credit ratings below investment grade (rated BB or lower by agencies like S&P and Fitch, or Ba or lower by Moody's). These bonds offer higher yields to compensate for higher credit risk.
A rising EURUSD is typically associated with a risk-on environment, where investors are more confident and willing to take risks. This can lead to reduced demand for safe-haven assets like the USD and increased appetite for higher-risk assets like equities and high-yield bonds.
In a risk-on environment, EURUSD tends to rise, and high-yield spreads narrow (improved confidence).
In a risk-off environment, EURUSD falls, and high-yield spreads widen.
The following shows the evolution of the index.
Interpretation 🔎: The support level on the index at 6.00 seem to correspond with 1.1200 on EURUSD. This assumption is of course not exact. However, either market reaching any of these levels first will give a contrarian view on the other market. The next meaningful resistance on this index is at 9.50.
INFLATION RATE MID-TERM MODEL
The US year-over-year (YoY) inflation rate measures the percentage change in the general price level of goods and services in an economy over a one-year period. It is one of the most widely used indicators to assess the health of an economy, showing how much prices have risen (or, in rare cases, fallen) compared to the same time in the previous year.
Inflation is commonly calculated using a price index, such as the consumer price index (CPI). The CPI measures the average price level of a basket of goods and services that represents typical consumer purchases.
Interpretation 🔎: Equity prices often perform well during periods of moderate inflation (e.g., 2%), which typically signals a growing economy. The model is showing a positive expectation for inflation, which correlates to further strength in equities for the coming months. Can Trump’s policies help confirm this soon?
THE AAII INVESTOR SENTIMENT SURVEY
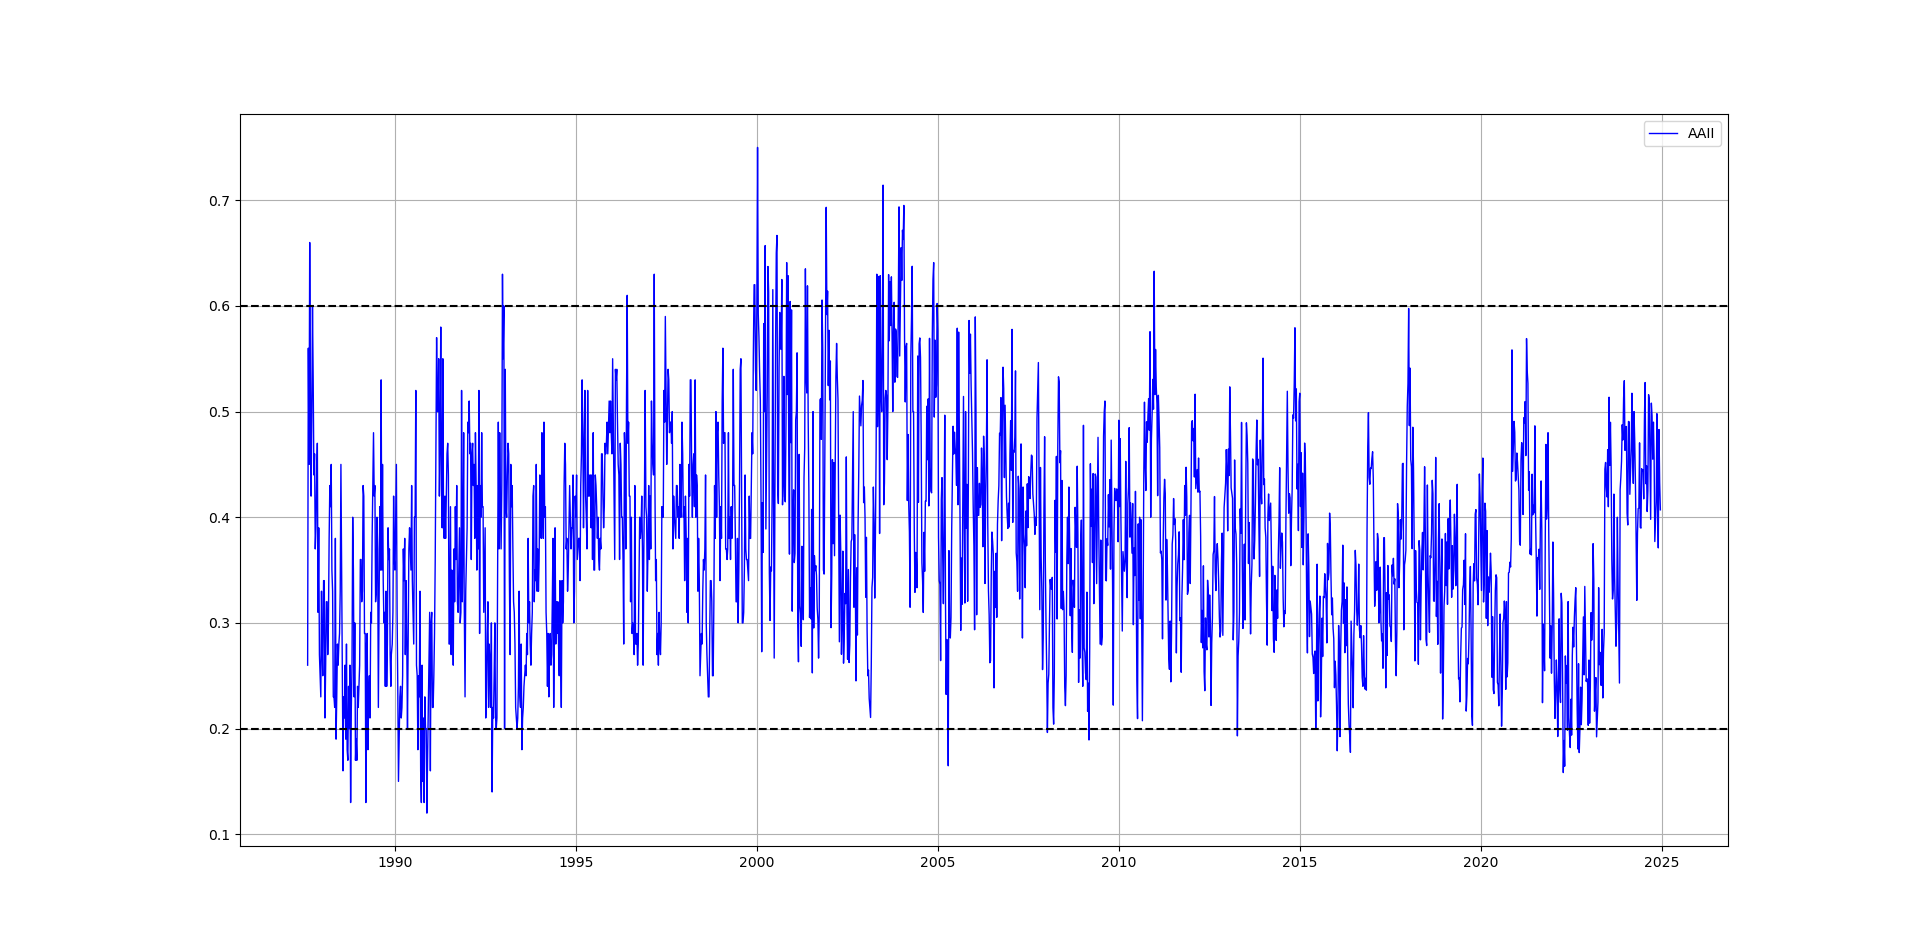
The AAII investor sentiment survey is a weekly survey conducted by the american association of individual investors that measures the mood of individual investors regarding the direction of the stock market over the next six months. Participants are asked whether they are "Bullish," "Bearish," or "Neutral" on the stock market's prospects over the next six months.
💡 The survey aims to gauge investor sentiment, which can be a useful contrarian indicator. When a high percentage of respondents are bullish, it can indicate market optimism and potentially a market top, while a high percentage of bearish respondents can suggest market pessimism and a potential market bottom.
It is worth mentioning that the AAII survey has a 0.20 correlation with the S&P 500 index, therefore it is weakly correlated to it, and may hint to possible reversals.
The following shows the evolution of the survey.
Interpretation 🔎: The index is approaching the resistance level but not quite there yet. Reaching it may give a bearish bias on stocks.
THE ISM PMI
The institute for supply management provides a monthly survey called the purchasing manager’s index abbreviated to ISM PMI, which is based on questions asked to 400 representatives of industrial companies about the current and future trend of their different activities. It is composed of 5 components that can also be analyzed individually:
New orders — 30% weight.
Production — 25% weight.
Employment — 20% weight.
Supplier Deliveries — 15% weight.
Inventories — 10% weight.
💡 Typically, we interpret the index as 50 being the neutral state of the economy (neither growing and neither shrinking). A reading above 50 indicates an expansion in manufacturing and a reading below 50 indicates shrinking in manufacturing.
The following shows the strategy applied on the index.
Interpretation 🔎: With around 80% of hit ratio, the strategy’s signals are to be taken seriously. Currently, no signal to mention.
If you want to see more of my work, you can visit my website for the books’ catalogue by simply following this link:
THE COT REPORT STRATEGY TRACK RECORD
You will find in this section the details of the previous COT signals from the COT report strategy. Note that this track record is only for illustrative purposes, it is not supposed to attract or solicit any type of action. It is a bookkeeping way of making sure that the techniques used are still delivering value:
The hit ratio is calculated using the directional method. This means that the moment the analysis published, an entry is assumed. If the target has been approached or attained, then the view is recorded as a good forecast. Otherwise, if the market clearly breaks the reaction area (support or resistance), it is recorded as a bad forecast.
💡All these views can be verified by accessing the previous newsletters in the homepage.
Do not hesitate to share your thoughts and forecasts in the comment section.
CORRELATION HEATMAP
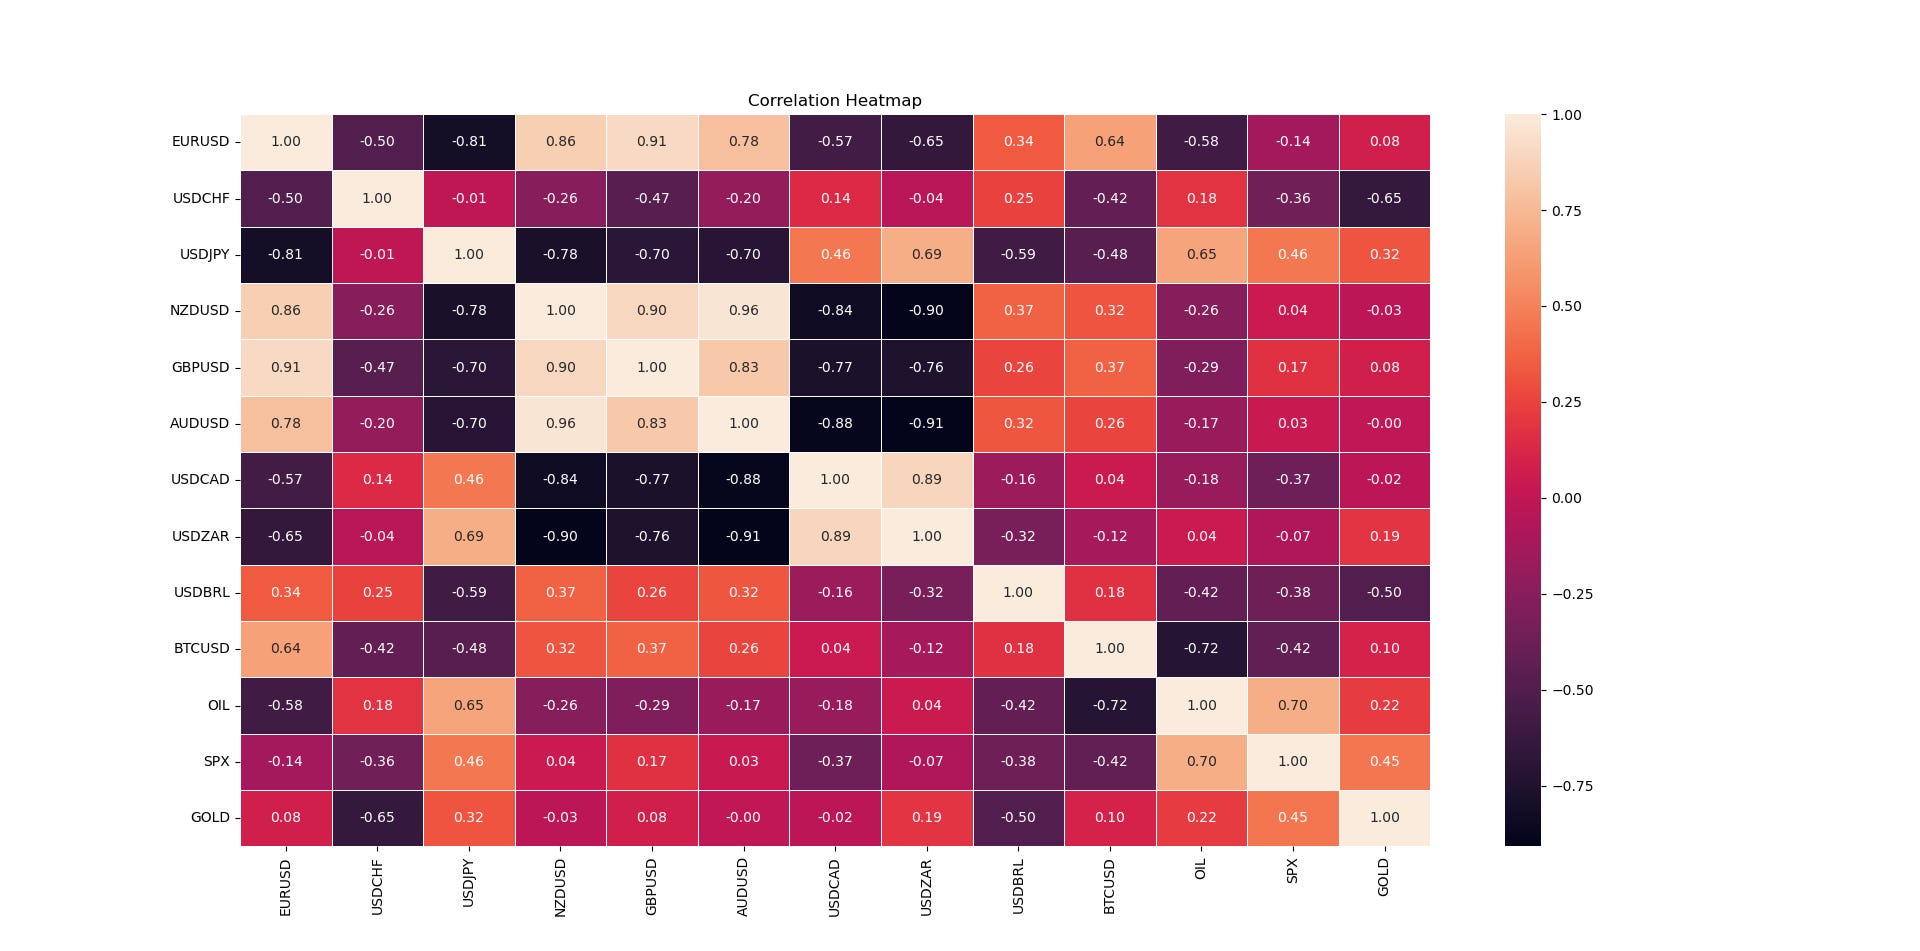
Correlation is a statistical measure that quantifies the relationship between variables. It measures how closely the returns of two or more assets move together. It ranges from -1 to 1. Understanding the correlations between different markets and asset classes is crucial for managing risk and expectations. The following shows the heatmap between different key markets.
A correlation close to -1.00 implies a negative relationship between the two markets (they move in opposite directions), while a correlation close to 1.00 implies a positive relationship between the two markets (they move in the same direction). Finally, a correlation close to zero implies that there is no linear relationship between the two markets (they may or may not move in the same direction).
CLOSED OPPORTUNITIES
This section highlights the previous charts given from the COT report strategy.
DISCLAIMER
Every information contained in the report is solely for the purpose of showing another angle. Since it is NOT investment advice or trade recommendations, you must NOT use the report as the sole reason for your trading and investing activities.
Trading is fun, enriching, and interesting but not when it comes at the expense of your hard-earned funds. Do not risk what you cannot afford to lose. You must only trade with money you have already considered gone and you must not use trading as your sole revenue generator. Risk management is even more important than the trading strategy itself, make sure to master it.
Data can have many representations and the information presented is but one side of the story which may be incomplete. All back-testing and forward testing results reflect their own time period and not the future as is the case in every research piece.


